A Different Approach to an Old Problem
Session Start End
-
AVERY (Albemarle Corporation)
Rare earth stabilizes zeolite and increases hydrogen transfer. Reducing the rare earth on zeolite will decrease the catalyst activity at the same zeolite content and matrix activity. Most refiners who reduce rare earth have increased the amount of active component. This increase has resulted in higher zeolite content and more matrix activity. This shift can be confirmed by higher surface area and higher alumina on fresh catalyst.
The results vary. In general, gas oil operations and mild operating FCCUs have experienced little decrease in activity. Resid units have either maintained the original rare earth or zeolite or rare earth on zeolite ratio as these are operated at lower activity. There have been several papers published that outline the use of non-typical rare earths or other elements to stabilize the zeolite. As an example, phosphorus has been used for decades to stabilize ZSM (Zeolite Socony Mobil) additives. At least one catalyst supplier has recently published the use of phosphorus to stabilize FCC catalyst. These substitutes generally do not provide the same level of cost-effective stability as rare earth. If they had, it would have been in common use in FCCs long before now.
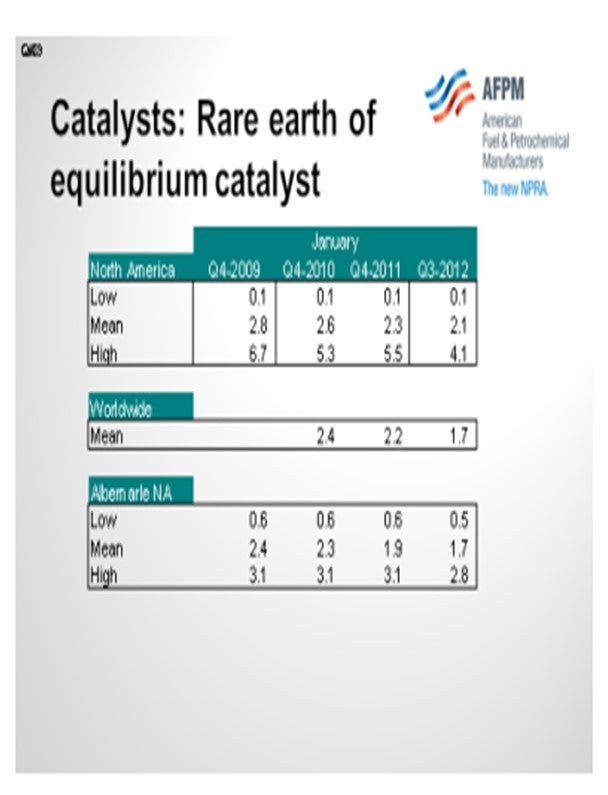
The effects of lower rare earth are widely known. They include higher LPG, lower gasoline, higher gasoline octane, lower activity, and lower delta coke. Even before the rare earth cost increased, Albemarle clients had the lowest rare earth in the industry. The slide shows a survey of all the North American e-cats, including when a refiner uses a SOx reduction additive that results in a slight increase in rare earth. If refiners are using a ZSM additive, it will make the rare earth go lower than the typical rare earth on the fresh catalyst.
Now look at some surveys of a couple of years of industry within North America and worldwide. You can see the highs in 2009 when it went from 6.7% down to 4.1% now. The average in North America has gone from 2.8% down to 2.1%. You could also see the comparisons for worldwide, Albemarle, and North America.
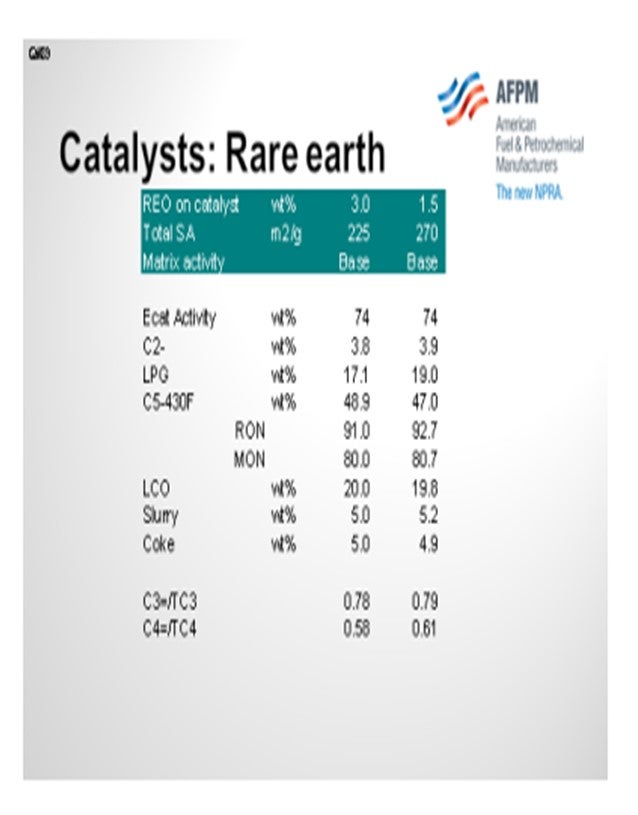
The next slide shows one catalyst system. For the matrix activity to be the same, all I did was go from 3% rare earth down to 1.5% rare earth; then with our models, I increased the zeolite until we got the same activity. I am just giving you an idea of how much more surface area or zeolite you will need in order to maintain the same activity. In this particular case, you have a catalyst going from 3% rare earth oxide to 1.5%. Due to the lesser stability of the lower rare earth, the zeolite surface area must go from 225 up to 270. With that, you will see more LPG, right? You will see lower gasoline and significantly more octane. Higher olefinicities will be present in the C3 and C4s.
BROOKS (BP Refining)
With the increase in rare earth cost, BP went through a series of reductions and rare earth on catalyst changes at a number of our sites. We did a bit of modeling work, and we decided not to drop the rare earth on every site we reviewed. Our models and the catalyst pricing with the surcharges at that time were used to evaluate our path forward. Our projected economics did determine an optimum point for each of our sites to get an idea of the appropriate rare earth on zeolite level within the balance of the manufacturing limits from the vendor.
For the sites on which we did make changes, we typically attempted to maintain rare earth on zeolite as much as possible to prevent the shift you should see in gasoline, LPG, and olefinicity and also to prevent the activity drop you would expect. We increased our zeolite surface areas on the sites where that was an option.
We have not yet had an opportunity to evaluate all of our changes. We have completed a lot of these reformulations. A base review of the operating data showed what we expected. In the units where we dropped rare earth on zeolite, we saw an increase in olefinicity and more LPG. Most of the time, we were able to balance that yield shift by backing out some of the ZSM-5 additive in use; so it was not really a problem for most of our units.
Many of our units that made adjustments to rare earth also dropped it in steps, especially if they were making very large changes in rare earth, so that made the yield pattern shifts a little less obvious. We saw what we expected in these step changes: an increase in catalyst addition rates for most of the units that made a significant drop in rare earth. We did not see a huge shift in the stability of the catalysts, especially in our hydrotreated units.
We do have one unit that runs some resid. In a situation like that, particularly with high metals, there is some nasty feed coming in with their resid stream. They saw what they thought was a drop in stability that required the addition of a lot more catalyst to maintain activity. They have come up on rare earth since the market prices have gone back down, but that is the only unit on which we went back up in rare earth levels because of the stability of the catalyst.
We have not seen any noticeable attrition shifts with the drop in rare earth. Also, we did a trial of a few of the rare earth-free catalysts blends. One of our sites actually adjusted the blend throughout the trial and would step more and more of the rare earth-free catalyst into the blend. They were able to step it up to 50% of their blend and did not feel as if they saw any difference in coke or bottoms makes. Again, that has not been fully evaluated, but they were happy with their yield patterns.
SCHOEPE (Phillips 66)
Phillips 66 actually reacted aggressively as rare earth prices increased. On average, the rare earth content was decreased by about 0.7%. In most cases, we tried to compensate for the decrease in the rare earth with an increase in activity. Overall, if we used e-cat activity as a benchmark, we really did not see a big decrease. One unit had a little bit higher activity; another one had lower activity. We did, however, see the effect that Cliff described. We saw a decrease in gasoline selectivity, which, in one unit, was great because they had additional capacity in the alkylation unit. Another unit struggled with increased LPG yield because they were wet gas compressor limited.
PIMENTEL (CITGO Petroleum Corporation)
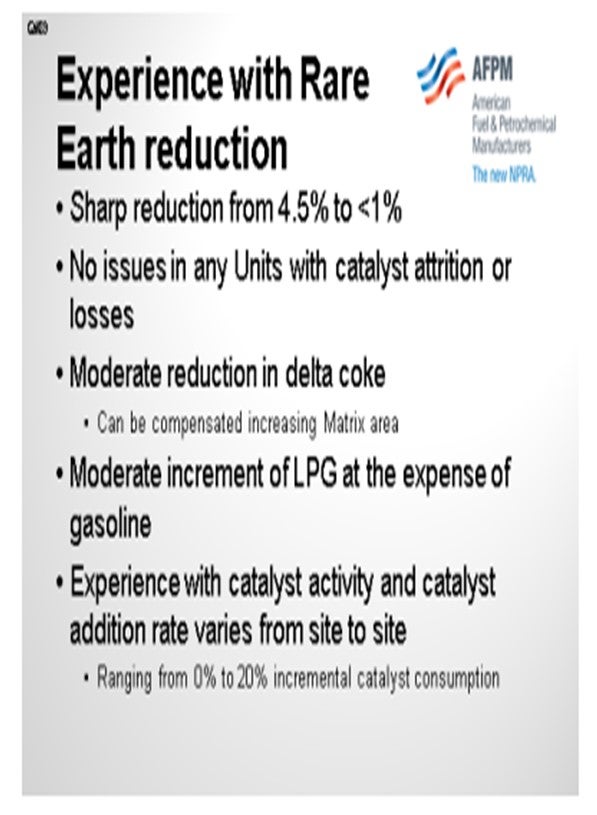
During that rare earth crisis, we had a sharp reduction in rare earth concentration from 4.5% to less than 1% in our catalyst. We found no issues with attrition or catalyst losses in any of our units. We did reformulate the catalyst to increase matrix surface area. That reformulation was done in anticipation of the lower delta coke resulting from that catalyst formulation. The LPG increment was very small: in our experience, less than 1%. The catalyst activity reduction experience changed from unit to unit. In some of our units, we stayed at the same catalyst addition rate to achieve the same activity; while in other units, we had to increase up to 20% of our addition rate.
JOSEPH McLEAN (BASF Catalysts LLC)
This past August at the 2012 Cat Cracker symposium in Houston, there was a session during which the three U.S. vendors all participated. Those presentations will all be on the AFPM website; so rather than rehash what was discussed, I will just direct you to the details within those transcripts. I also want to point out that as the rare earth prices have gone down, the quantity of rare earth being used by the customers has increased]. Our average shipping content for the past two quarters has bottomed down the first quarter of this year. The content is not quite back to where it was two years ago, but this quarter shows that it is heading in that direction.
AVERY (Albemarle Corporation)
Rare earth (RE) stabilizes the zeolite and increases hydrogen transfer. Reducing the RE on zeolite will decrease the catalyst activity at the same zeolite content and same matrix activity. Most refiners who reduce RE have increased the amount of active component. This has resulted in higher zeolite content and more matrix activity. This shift can be confirmed by higher surface area and higher alumina on fresh catalyst. The results vary. In general, gas oil operations or mild operating FCCUs have seen little decrease in activity. Resid units have either maintained the original RE on zeolite or operated at lower activity. There have been many published papers outlining the use of non-typical REs and other elements for zeolite stabilization. As an example, phosphorus has been used for decades to stabilize ZSM-5 additives. At least one catalyst supplier has recently published the use of phosphorus to stabilize FCC catalyst. These substitutes generally do not provide the same level of cost-effective stability as rare earth; if they had, they would have been in common use in FCC catalyst long before now. The effects of lower RE are widely known. They include higher LPG, lower gasoline, higher gasoline octane, lower activity and lower delta coke. Even before the RE costs increased, Albemarle clients had the lowest RE in the industry. North American averages are listed below.
BROOKS (BP Refining)
BP decreased rare earth levels on a number of units due to the high rare earth cost environment last year. If possible, we targeted reduced rare earth (RE) levels with increased zeolite (Z) surface area to the offset the reduction in catalyst stability and minimize the impact on catalyst additions/activity. Although we targeted minimal shifts here, our unit reformulations typically resulted in some drop in RE/Z which was expected to cause increases in LPG yield, a decrease in gasoline yield, and an increase in LPG and gasoline olefinicity. However, in some cases we were able to adjust the ZSM-5 usage rates to manage the selectivity shifts that come with a change in RE/Z ratio.
In our analysis to determine the most profitable RE level for each unit, we used our FCC process model to optimize the unit operating conditions against each sites’ commercial pricing projections and unit constraints for various RE levels in the catalyst. This allowed us to consider the impact of the predicted yield shifts and catalyst addition rates in conjunction with the shifting catalyst prices (including RE surcharges) to identify the conditions that would result in the highest unit margin. In some cases, the model work resulted in reduced e-cat MAT for operating cost reductions which was then balanced by increased riser temperatures to maintain conversion. For these cases, a shift in delta coke was predicted. However, in cases where the e-cat MAT and other operating conditions were maintained, the delta coke was projected to remain unchanged as long as the metals levels on e-cat did not shift significantly. This could also be said about conversion; i.e., lower optimized MAT would yield lower conversion, but constant MAT and operating conditions would result in no change. Our FCC process model was used to select an optimized RE level based on each sites’ commercial pricing projections, unit constraints, yield shift projections, shifts in catalyst addition rates, and catalyst prices (including RE surcharges). Because there was some uncertainty around the expected catalyst addition rate and yield shifts, many of our units that were making a large shift down in RE levels did it sequentially by stepping their RE levels down to the optimum suggested in the modeling studies.
We have not yet had an opportunity to complete full evaluations on these RE shifts so cannot be sure of the absolute yield and catalyst addition shifts observed. However, unit yields appear to have made the expected step changes in LPG and gasoline yields and olefinicity. Addition rates have gone up slightly as expected. Catalyst stability seems good in the majority of our units. One unit which periodically runs high levels of metals on e-cat due to feed contaminants noted a drop in catalyst stability at heavy metals loading and has since increased RE levels slightly to handle swings in feed quality better. We have not seen any changes in attrition with the lower RE catalysts. We have one site that has trialed a RE-free catalyst as part of a blend with another RE catalyst. Their trial showed no significant shifts in coke or bottoms yield at blend levels of up to 50% RE-free catalyst. We have another site who has implemented a catalyst blend which includes and RE-free portion of the formulation. This was a recent change and has not yet been evaluated for actual yield and addition rate shifts. However, they have not noticed any significant issues with operation on this catalyst via regular unit monitoring methods.
SCHOEPE (Phillips 66)
As rare earth prices increased, the average rare earth content on Phillips 66 units was decreased by 0.7 wt% to about 2.0 wt%. In most cases we compensated for the lower rare earth content by increasing zeolite content to maintain target equilibrium activity. Although one unit saw an increase in equilibrium catalyst activity and one saw a decrease, most of our units maintained constant equilibrium catalyst activity, despite the reduction in rare earth content. In general, this reformulation caused the gasoline selectivity to decrease slightly at the same conversion, with the expected increase in LPG selectivity. This change might have caused problems for units with wet gas compressor constraints.
PIMENTEL (CITGO Petroleum Corporation)
In one unit, we lowered rare earth on one FCC from 2.8 wt% to 1.35 wt% and made a modest formulation change. Catalyst additions had to be increased by 20% to 25% to maintain the same e-cat activity. Even with a significant reduction in stripping steam, delta coke dropped by 0.05 wt% to 0.07 wt%. LPG yield increased by approximately 1 LV%. Conversion was unchanged. We did not have any attrition or opacity issues. In another unit, we reduced rare earth from 4.5% to less than 1% and increased matrix area to compensate for the expected lower delta coke. We experienced a moderate increment in C2- and LPG production (~5%) at the expense of gasoline. We did not experience incremental catalyst attrition or loss of activity at constant catalyst addition rate.
ROSANN SCHILLER (Grace Catalysts Technologies)
Rare earth plays a key role in FCC catalyst and has been traditionally used in stabilizing zeolite which preserves catalyst activity and modifies selectivity. Rare earth has also been successfully utilized as a contaminant metals trap, reducing deactivation caused by vanadium.1 There are several different avenues one could take to lower rare earth on catalyst with wide ranging impacts on FCCU yields and selectivity's. The following avenues will be discussed:
1. Lowering rare earth on zeolite,
2. Lowering rare earth and using a rare earth substitute, and
3. Lowering rare earth used for metals traps
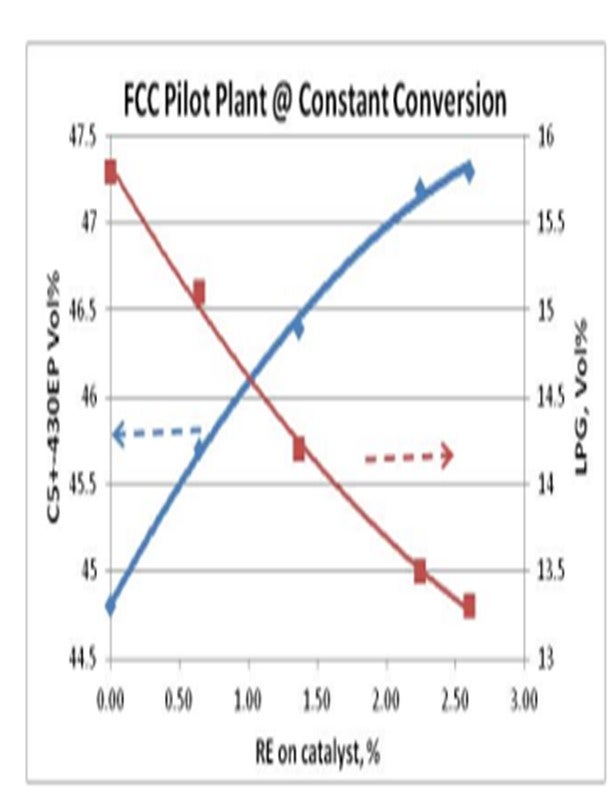
Simply lowering rare earth on zeolite with no other changes made to the catalyst system will typically reduce catalyst activity at similar catalyst additions. Conversely, higher catalyst additions will be required to maintain similar catalyst activity. If activity/conversion is maintained, catalysts with lower rare earth will typically be more LPG selective than gasoline selective. The graph below showing this relationship was presented at the 2012 Cat Cracking seminar. The data are pilot plant yields from merely reducing rare earth on an FCC catalyst with constant zeolite and matrix input.
For further information on the function rare earth plays in FCC catalyst and yield selectivity's, please refer to the Grace Davison paper, “Role of the Rare Earth Elements in Fluid Catalytic Cracking.”4 One thing to note is that removing rare earth from FCC catalyst typically provides relief in catalyst expenses but is not necessarily an economical solution as most FCC operations cannot accommodate lower activity and/or product value.5
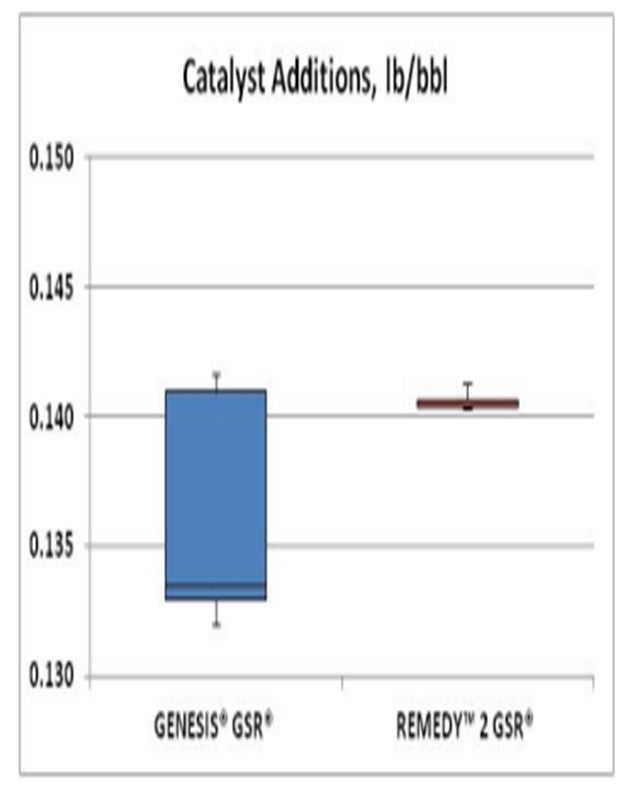
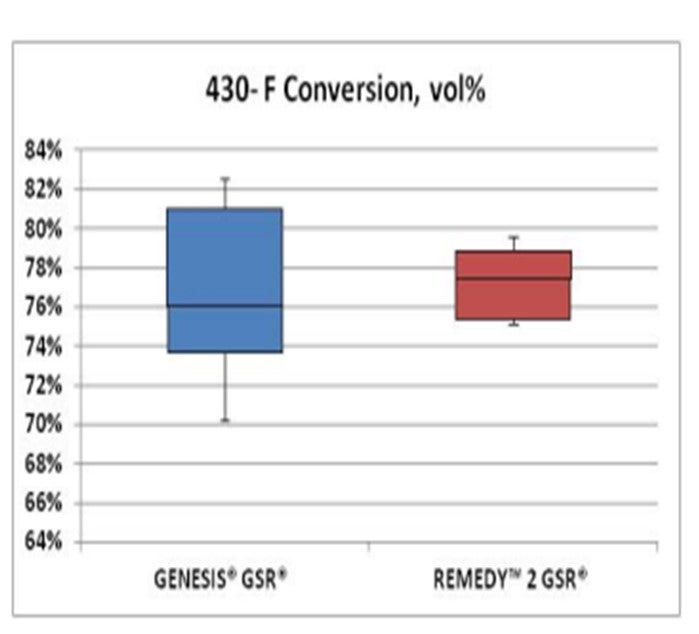
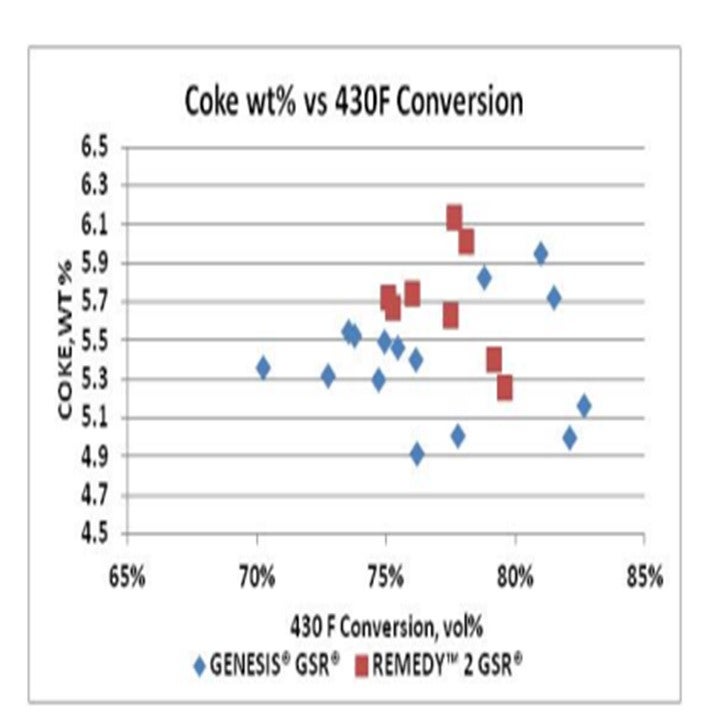
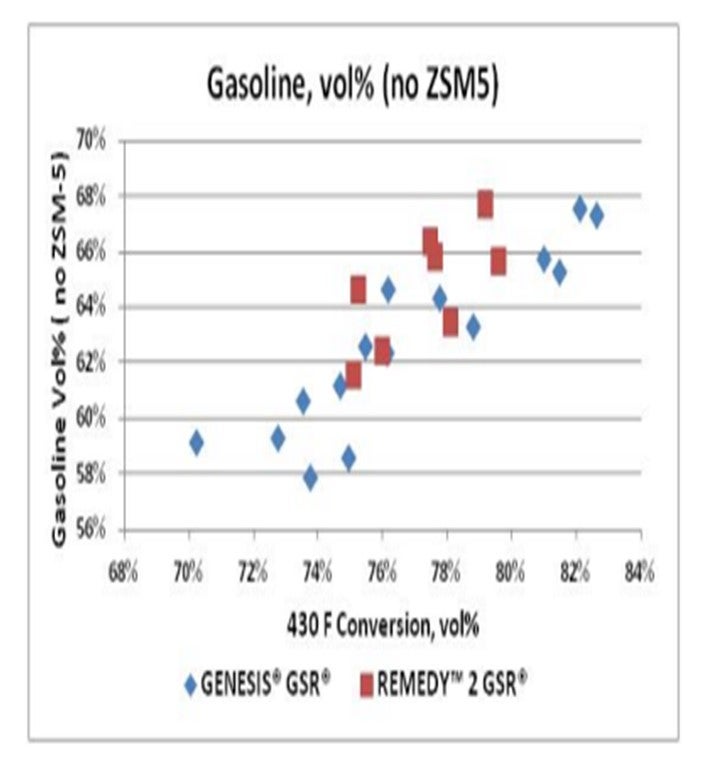
One alternative to lower rare earth while maximizing FCCU profitability is to use alternate materials and processing to stabilize the zeolite. Grace has recently added the REpLaCeR® family to its catalyst portfolio. REpLaCeR® is a collection of low and zero rare earth catalysts which have been applied in a wide range of FCC applications. 6 REMEDY™ catalyst, one of the REpLaCeR® family of catalysts with zero rare earth content, has been proven to have similar unit conversion at similar catalyst additions, similar slurry/coke selectivity, similar e-cat activity, and higher gasoline selectivity when compared to a moderate rare earth containing catalyst. In one refinery example, the catalyst was reformulated from a traditional 1.5 wt% rare earth catalyst, GENESIS®GSR®, to REMEDY™2 GSR®.7 As shown in Figures 2 and 3, the catalyst additions on a pound per barrel of feed basis were maintained with REMEDY™2 GSR® while maintaining similar conversion. Figure 4 shows both catalysts have similar coke selectivity.8 Also, REMEDY™2 GSR® proved to be more gasoline selective when compared to GENESIS®GSR® which is shown in Figure 5.9 It is also worth noting that the lower rare earth catalyst reformulation in this example did not negatively impact catalyst retention.
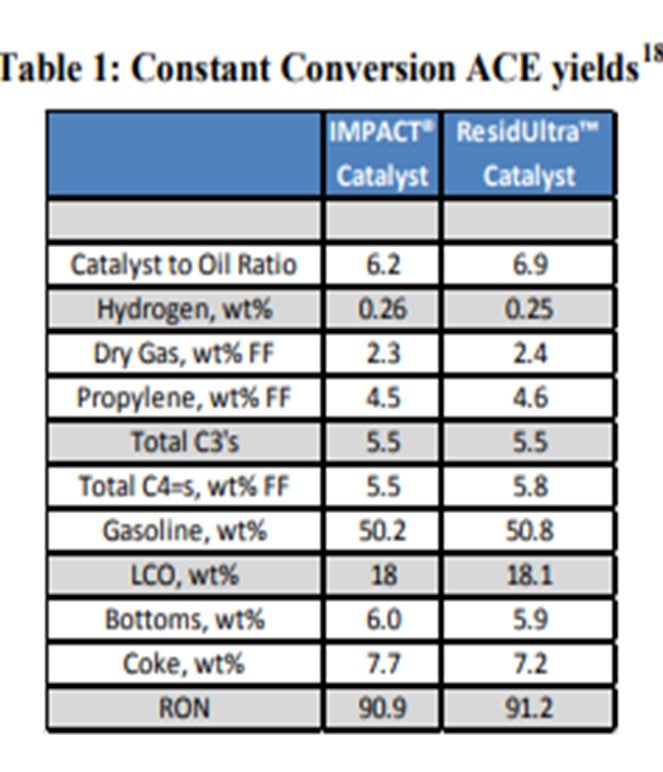
With regard to rare earth being utilized as a metals trap, Grace has been successful reducing rare earth by 40% without sacrificing activity or selectivity with the re-optimization of our IMPACT® technology, ResidUltra™14. Commercial experience proves that unit performance is nearly interchangeable.15 In lab testing ResidUltra™ and IMPACT® samples were deactivated with metals levels of 3,000 ppm V and 2,000 ppm Ni and tested side by side in the ACE unit over a residual feedstock.16 The constant conversion data is summarized in Table 1. In this scenario, relative to IMPACT®, ResidUltra™ has similar catalytic activity, the same hydrogen selectivity, slightly better coke selectivity, similar gasoline, similar LCO, and similar bottoms yield.17 ResidUltra™ yields slightly higher-octane number and LPG olefins.
In summary, the means by which a catalyst supplier might lower rare earth may have no impact or a substantial impact on catalyst activity and FCCU yields and selectivities. Your unit objectives and constraints will dictate which catalyst reformulation best fits your FCCU.
AVERY (Albemarle Corporation)
ZSM-5 usage is widely used in FCC units trying to maximize propylene. ZSM-5 usage is just as popular in resid units as it is with gas oil units. We have seen high propylene yield units, resid units with feeds greater than 6 Conradson carbon residue, and e-cats that exceed 10,000 ppm nickel plus vanadium.
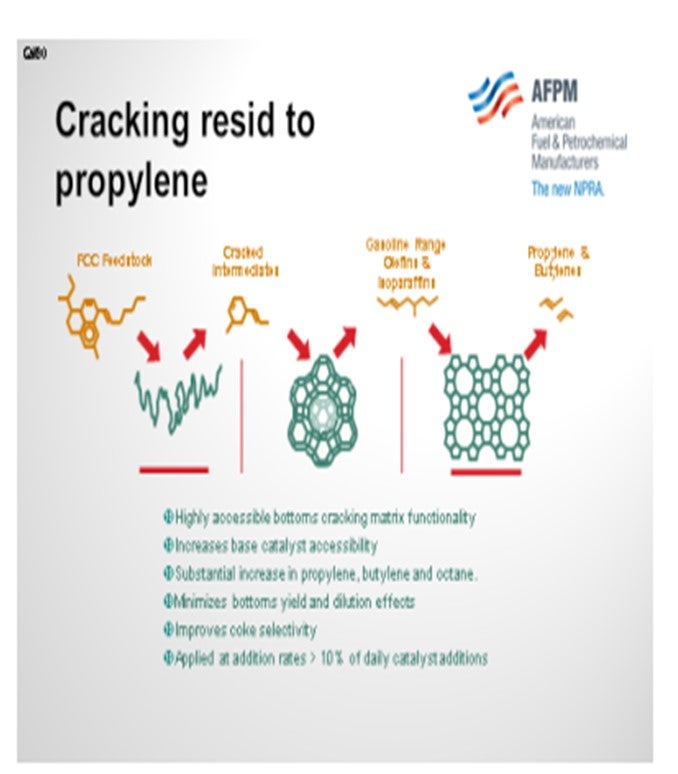
The question was whether ZSM can crack resid. The short answer is no. The long answer is that if you have good catalyst component systems, matrix components, and zeolites, you will be able to crack the FCC feedstocks into light cat naphthas. Basically, the olefins of the light cat naphthas can crack into propylene. The effects we saw that helped resid units make more propylene were using a high accessibility catalyst and preventing dilution effects, as well as the list shown on the slide.
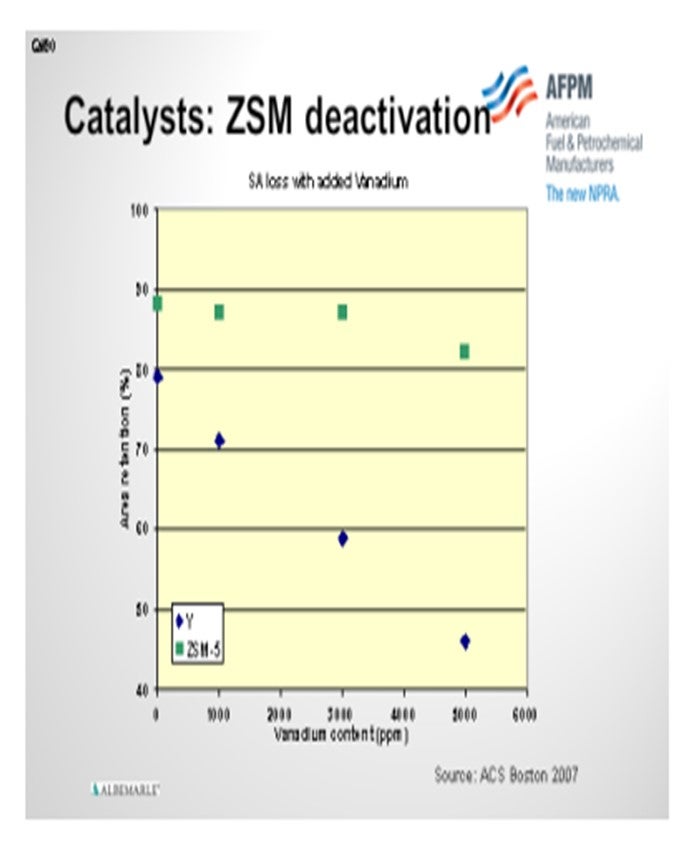
ZSM will deactivate, but much slower than Y-type zeolites. ZSM-5 has a far higher silica-to-alumina ratio and dealuminates less than Y zeolites. In an ACS (American Chemical Society) Boston 2007 report, we revealed that ZSM is less affected by hydrothermal steam conditions and metals effects from vanadium, in particular. You see this result on the slide. Shown on the Y axis is surface area retention. This particular test used pure component systems; so when you see the ZSM, you know that it represents a pure ZSM in Y. It is also a pure Y zeolite. The zero point is just steaming at 800°C; that is, 100% steam for five hours. The graph shows that at those conditions, the ZSM has maintained 88% of its original surface area, while U.S. Y-type maintained only 79%. As we increased the vanadium levels on the catalyst, there was a decrease in retention for both the ZSM and the Y zeolite. However, you can also see a bigger decrease in the Y-type zeolites with increased vanadium.

LALL (UOP, A Honeywell Company)
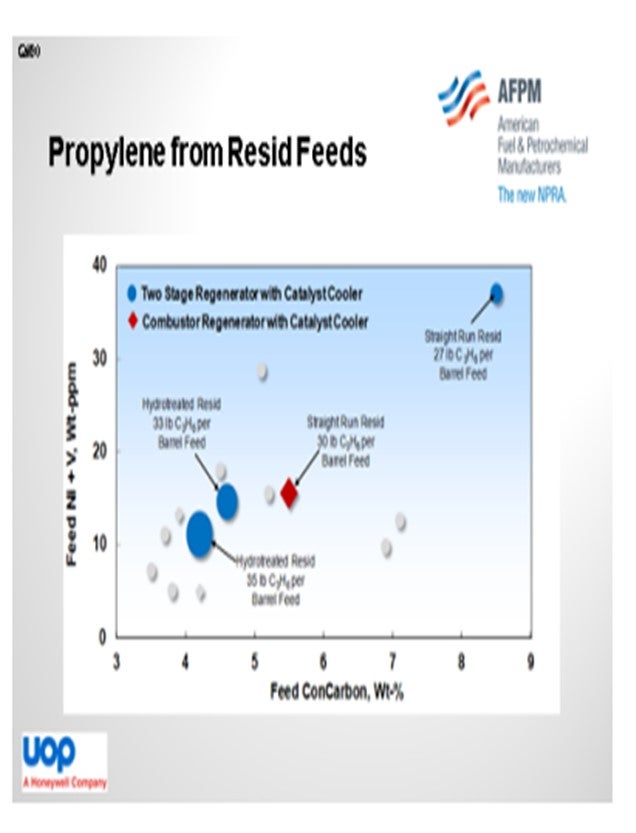
UOP’s resid FCC technology, coupled with FCC catalyst systems incorporating the use of ZSM-5 additive, has been successful producing propylene at levels as high as 10 wt% to 11 wt% on fresh feed. The slide shows a typical propylene yield from various UOP resid FCC units operated in propylene mode for varying total feed metals versus feed Conradson carbon for both two-stage regenerators and high efficiency combustor-style regenerators.
We have several commercial units. A couple of them are operating above 4 wt% Conradson carbon residue, and a few operate above 7 wt% Conradson carbon residue. Optimization of the resid FCC operation and ZSM-5 addition can overcome the challenges associated with processing resid feedstocks. The slide shows a consistent correlation between propylene production and feedstock quality.
While it is recognized that vanadium has a strong deactivating effect on Y zeolite, its deactivating effect on ZSM-5 has not been as widely recognized or documented. Much of the current understanding of the effect of vanadium on ZSM-5 has been derived from deactivation indices for Y-zeolite. Measurements of ZSM-5 surface area and poor volume retention remain fairly unchanged even after a simulated deactivation by deposition of vanadium at high levels, as high as 5,000 ppm. Additionally, standard acidity measurements do not appear to be strongly affected by the presence of vanadium on the catalyst surface either. It has been hypothesized that due to the lack of property shifts, the presence of vanadium has minimum impact on ZSM-5 deactivation; but due to uncertainty expressed by the industry, this theory is under investigation.
JOSEPH McLEAN (BASF Catalysts LLC)
I have a few comments. First, heavier feed units tend to turn over the inventories faster. We tend to think of ZSM-5 levels in terms of percentage of fresh catalyst; but if you are turning the inventory of the catalyst over faster, then you are adding more ZSM-5 and turning it over faster as well. Whenever you are trying to compare heavy feeds versus light feeds, you need to keep that effect in mind. We recently had an opportunity with one customer who went from a hydrotreated gas oil and essentially very, very low metals on the e-cat at 100 ppm levels to 3,000 ppm nickel with some strange feed that they had received over a period of just a few weeks. So we saw how that changed in a very rapid response. There were some changes in the propylene yield on the unit, but they were due to better effects of the feed. When we looked at the e-cat selectivity with standard testing, there was no change in the propylene selectivity for that kind of a rapid change. We did analyze the e-cat microscopically; and just by looking for association of nickel with phosphorous, we basically did not see any change. Nickel does not seem to affect ZSM-5 particles, as you would expect, because the nickel cracks from the asphaltenes and basically stays where it cracked. Vanadiums are a little more difficult to analyze because of their mobility. But in this case, there was not a lot of vanadium, just high nickel.
DR. PAUL DIDDAMS (Johnson Matthey Intercat) I agree with what Joe said. I also have a comment about Cliff’s chart where he showed the surface area retention versus steaming. That is basically what we see, too. What the chart does not take into account is the dealumination of the ZSM-5. You are showing around a 10% reduction relative in activity, which is less than what I have seen.
PATRICK BULLEN (UOP, A Honeywell Company)
My question is related to ZSM-5. It is a little bit different and off-topic. Has anyone noticed a trend in the increased use of ZSM-5 with an increase in acetone in the C4 streams coming off the unit?
BROOKS (BP Refining)
I would not say no, but we have not looked at it.
PATRICK BULLEN (UOP, A Honeywell Company)
So, you think it is a secondary reaction that might be caused by the ZSM-5?
PIMENTEL (CITGO Petroleum Corporation)
We do measure oxygenates in the LPG in the BBs. But in our case, they are mostly related to oxygenates in the feed or some oxygen coming in with the aerated catalyst flow back to our reactor. So, you will think that the incremental production of olefins, because the ZSM-5, would actually reduce the concentration of oxygenates.
DR. PAUL DIDDAMS (Johnson Matthey Intercat) I am sure that acetone is measured quite widely. As catalyst suppliers, we do not tend to get it reported to us very often. ZSM-5 has been around in FCC for over 20 years. So, if there had been a strong relationship between acetone and ZSM-5 usage, it would probably have come to our attention by now; but it has not, and I do not think anyone here is jumping up and saying, “Yes, I have seen that.”
AVERY (Albemarle Corporation)
ZSM-5 usage is widely used in FCCU operations to maximize propylene yields. ZSM-5 usage is just as popular in resid as it is with gas oil operations. High propylene yield units include feeds greater than 6 wt% CCR (continuous catalyst regeneration) and e-cat metals exceeding 10,000 wppm Ni + V. The small pored ZSM-5 is unable to directly crack the large pore resid molecules. To maximize propylene, refiners must optimize their operating conditions, unit design, and FCC catalyst systems to first maximize light naphtha olefins. Catalyst systems with low hydrogen transfer and high accessibility work the best for maximizing light naphtha olefins. ZSM-5 additives or other proprietary technologies will then crack these abundant naphtha olefins to yield high levels of propylene.
ZSM-5 will deactivate, although at a slower rate than Y-type zeolites. ZSM-5 has a far higher SAR (silica to alumina ratio) and dealuminates less than Y-type zeolites. An ACS Boston 2007 report reveals that ZSM-5 is less affected by hydrothermal (steam) conditions and metals (vanadium) contamination than traditional Y or U.S.Y zeolites.
LALL (UOP, A Honeywell Company)
UOP Resid FCC technology, coupled with FCC catalyst systems incorporating use of ZSM-5 additive, have been successful at producing propylene at levels as high as 10 wt% to 11 wt% propylene on fresh feed. The figure below provides a broad summary of the typical propylene yield from various UOP RFCC units operating in propylene mode at various total feed metals on equilibrium catalyst versus feed Conradson carbon content.
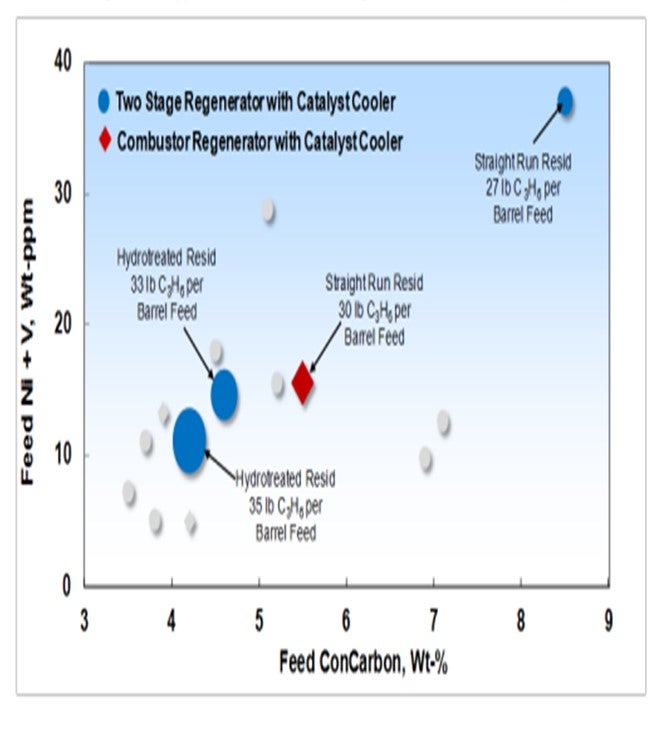
Optimization of UOP RFCC technology operation and ZSM-5 addition can overcome the challenges associated with processing resid feedstocks. Figure 1 shows the consistent correlation between propylene production and feedstock quality.
While it is widely recognized that vanadium has a strong deactivating effect on the Y-zeolite, its deactivating effect on the ZSM-5 has not been widely recognized nor documented. Much of the current understanding of the vanadium effect on ZSM-5 has been derived from the deactivation indices for the Y-zeolite. Measurements of ZSM-5 surface area and pore volume retention remain fairly unchanged even after simulated deactivation by deposition of vanadium at levels as high as 5,000 wppm. Additionally, standard Lewis & Bronsted acidity measurements do not appear to be strongly affected by the presence of vanadium on the catalyst surface either. It has been theorized that due to a lack of property shifts, that vanadium presence has a minimal impact on ZSM-5 deactivation; but due to uncertainty expressed by the industry, this theory is under investigation.
ROSANN SCHILLER (Grace Catalysts Technologies)
Yes, ZSM-5 additives are being used successfully, for example, in Asia and the Middle East, where the predominant FCC feedstock for maximum propylene FCC units is heavy, high metals resid. We have developed our AP-PMC and PROTAGON catalyst platforms to address the demands of these units. IN addition, there are numerous resid applications around the world that target moderate propylene increases in which ZSM-5 additives are used. Regardless of the product to be maximized, the foundation for a superior resid cracking catalyst is coke-selectivity and bottoms cracking activity. These are the primary considerations in the design of these catalyst families. Grace’s ZSM-5 additives such as OlefinsMax, OlefinsUltra, and OlefinsUltra-HZ are being used successfully in many resid units, together with AP-PMC, Protagon, Impact, Nektor-ULCC, and ResidUltra.
Industry experience indicates that high levels of Ni + V do not affect the performance of Grace’s ZSM-5 additives. Our customers have operated successfully with a combined Ni +V of up to 13,500 ppm. On the other hand, feed properties have a significant influence on product yields, including propylene selectivity.
Fundamental research has shown that ZSM-5 additives do not accumulate metals at the same rate as base cracking catalysts. This, in part, helps to explain why metals effects on ZSM-5 are not easily observed in commercial operation.
HARVEY MCQUISTON (Technip Stone & Webster)
The use of ZSM-5 has been well demonstrated in Resid FCCs. Due to the small pore size and the shape-selective nature of ZSM-5, the effect of Ni and V is much less than it is on the base FCC catalyst. The main effect of Ni and V is that Resid FCCs normally require a higher catalyst makeup rate (and withdrawal rate) to control metals at an acceptable level and therefore the ZSM-5 makeup rate is higher because it gets flushed out with the base FCC catalyst. The two-stage regeneration technique utilized in the Technip Stone & Webster Resid FCC design provides more catalyst tolerance to Ni and V and therefore reduces makeup cost of both base FCC catalyst and ZSM-5.
BROOKS (BP Refining)
Most of BP’s units are now transitioning from about a four-year turnaround cycle to a five-year. We have some units already running five years between turnaround cycles without necessarily showing evidence of higher wear and tear. We do not typically need to perform any mini-turnarounds or swoop-downs unless there are some extraordinary circumstances where we know equipment is broken and have to go in for repairs. Our unit reliability has been very high, so that is not really a concern for us when switching from a four-year to a five-year cycle.
We have done some internal Availability Improvement Studies and identified turnaround duration as a significant focus. Some of our turnarounds get a little long. It does not seem to correlate directly with our units that have longer time between turnarounds though, so I would not necessarily relate those together. We have quite a few units that are 100% hydrotreated feed, and a number of others that run untreated gas oil and resid. Both of those types of units have been able to do five-year runs. We have not seen any correlation between feed types and any issues with longer runs.
Right now, we actually have one unit that is planned for a five-year turnaround run. This unit is pushing its turnaround out another six to 12 months by doing a very, very small swoop-down or mini-turnarounds to make very minor corrections. The units have not had any other significant operational or reliability issues. Obviously, as you increase the length between turnaround cycles, you do have an increased risk of unplanned outages and slowdowns, especially near the end-of-run. A typical area of concern when you push your turnaround cycle out is having a very large turnaround scope. As I mentioned, worn cyclones causing catalyst loss increases, gas plant reboilers and exchanger fouling, feed nozzle erosion, flue gas system fines deposition, air grid erosion, and transfer line coking are among numerous items that can become concerns when pushing towards longer runs between turnarounds. So, there are obviously risks for pushing your turnaround cycles out. We have looked at some of them, and we feel comfortable moving most of our units to a five-year cycle.
There is an additional consideration that might affect you. Some of our units have mandated inspections on certain pieces of equipment based on local regulations and may require a shorter turnaround cycle. Thus, some might have to do mini-turnarounds or swoop-downs to meet those requirements, or they may have to plan for shorter turnaround cycles.
LALL (UOP, A Honeywell Company)
In our experience, most FCCs are achieving four- to five-year runs. There are a number of factors that determine the onstream reliability of the FCC. To say that longer run life equates to less reliability and more unplanned shutdowns is not an automatic conclusion. The key to maintaining onstream reliability is that the important components of the reactor regenerator are controlled during operations, as should be the operating variables during the course of the run.
A health check philosophy is used to identify all of the reactor regenerator’s critical components. A priority table identifies the key design parameters and compares those values to actual operating values seen in service. For items identified as running above design limit, repairs are expected. A plan is then devised such that those high priority items are seen first during the inspection discovery phase. There is then a plan for either a quick repair, a repair with modifications, or complete replacement with upgraded or improved technology.
The other aspect of the health check is the monitoring of erosion, particularly for cyclones. The amount of cyclone or erosion observed is directly proportional to the velocity at which they are operated. Therefore, it is fairly easy to predict the level of expected erosion by reviewing the operating history. While the health check is a great tool for predicting problems, the mini shutdown is a great opportunity for verifying those predictions, as well as discovering any new potential problems.
While the mini-turnaround generally does not allow for any major repairs, it does allow the units to continue operating until proper adjustments and repairs can be made. In general, the mini-turnaround does not improve reliability, but it does give the refiner a chance to redo some quick fixes that were made, perhaps unexpectedly, during the last turnaround. The mini-turnaround also provides a great gauge to establish the amounts of expected repairs.
WILLIAMS (KBR)
At KBR, we also agree that a typical, normal FCC turnaround is around four to five years. But in order to achieve this interval, we believe that it requires well controlled operations. To support what my colleagues stated earlier, to achieve longer turnaround cycles requires operating within the recommended design parameters as far as feed rates, properties, and temperatures, as well as catalyst circulation rates and superficial velocities, to just name a few.
VILAS LONAKADI (Foster Wheeler USA Corporation)
I think Jesse mentioned remaining within the design parameters. Those of you who are having five years, and even beyond five years, are you really operating at design or are you below the design? On what percentage of units can you still achieve five years and longer?
BROOKS (BP Refining)
It depends on which unit we are looking at in our system. We have some units that are running below their design capacities, but we also have some running at or above their design capacities on most days. As Jesse mentioned, these units will target superficial velocities in the regenerators to make sure their cyclones can make run-length. They will focus more on their KPIs if they are pushing their run-length and running near their design limits. We do have some units that make it longer because they run a little bit further below their design limits due to other constraints, not because we do not want to run feed.
BROOKS (BP Refining)
BP is trying to transition most of its units from four-year to five-year cycles. Our five-year turnaround cycle units do not tend to see higher “wear and tear” than our shorter cycle units and “mini-turnarounds” have not been necessary except in special/unusual damage cases. Our unit reliability is typically high. Internal availability improvement studies have identified turnaround duration as a significant focus area for the future, but this does not appear to correlate directly to our units with longer time between turnarounds. While our units running 100% hydrotreated feed typically run on five-year cycles, we have multiple units running resid who also successfully operate on a five-year turnaround cycle plan. One of our units recently planned for a five-year turnaround cycle and is pushing their maintenance turnaround out another six to 12 months by doing a brief “swoop-down” for minor repairs. Thus, allowing them to take advantage of favorable market conditions forecasted. With this swoop-down, the unit will meet a six-year cycle on this run.
A previously owned BP unit ran a seven-year cycle with no mini-turnarounds in the middle. While this was certainly impressive, notes suggest that the final turnaround scope after this run was extremely large and required significantly more manpower than typical turnarounds.
Increasing the time between turnarounds can certainly increase the risk of unplanned outages and slowdowns, especially near end of run. Typical areas for concern when considering longer turnaround cycles include: large turnaround scope, cyclone wear and resulting increases in catalyst losses, gas plant reboiler and exchanger fouling, feed nozzle erosion, fines deposition in the flue gas system, air grid erosion, and transfer line coking. Some site equipment can also be affected by mandated inspections that may fall within a longer turnaround cycle window (less than five-year cycle).
WILLIAMS (KBR)
A normal FCC turnaround interval is approximately five years and requires a well-controlled operation to achieve this interval. The unit needs to be operated within its design parameters (feed rate, feed properties, temperatures, pressures, catalyst circulation and superficial vapor velocities among others) to avoid afterburning and thermal damage to cyclones and excessive erosion of the air distributor and other key internal equipment. Extension of the turnaround interval would not be possible if the unit is already operating with unresolved reliability issues.
LALL (UOP, A Honeywell Company)
There are a number of factors that determine the onstream reliability of the FCC; to say that longer run life equates to less reliability (i.e., unplanned shutdowns) is not an automatic conclusion.
The key to maintaining onstream reliability is that the key components of the reactor-regenerator are monitored during operation, as well as controlled as should be the operating variables during the course of the run.
The health check philosophy is an engineering-based tool used to identify all of the critical components of the reactor-regenerator by a priority table that identifies the key design parameters for the given equipment and compares those values to the actual operating values seen during operation. These variables are typically capacity (flux/volume), flow (velocity), temperature and pressure. For those items identified as running "above" design limit, repairs are expected, and a plan is devised such that those "high priority" items are seen first during the inspection discovery phase of the turnaround and there is a plan for either a quick repair (replacement in-kind), alternate repair with modifications, or complete replacement with upgraded or improved technology. The more items that are identified and pinpointed during this health check process, the more planning can go into the turnaround to minimize unknowns during the turnaround. Several refineries have adopted a policy of planned replacement during shutdowns, so that in-situ repairs are avoided. Ideally, these refineries localize and rotate the majority of maintenance for a given unit so that they do not overload the manpower requirements for any one turnaround. For example, the refiner would do reactor work (and cyclones) for the unit one turnaround, with regenerator work (and cyclones) the following turnaround, and with work on the flue gas in the subsequent turnaround.
The other aspect of the health check is the maintenance of erosion - particularly for cyclones. The amount of cyclone erosion observed is directly proportional to the velocity at which they are operated. Therefore, it is fairly easy to predict the level of expected erosion by reviewing the operating history and estimating the level of expected erosion. The same holds true for standpipes and risers. The key is to map the known critical areas and determine the severity of service it has experienced between campaigns (run-lengths) to gauge the level of expected repairs. The health check is also a good tool for judging the impact of "pushing" the unit beyond design limits, or running the unit with a severe/contaminated feed. Additionally, the effect of excessive turndown can also be predicted and planned for. The success of the turnaround planning is the coupling of the current process conditions with the known mechanical problem areas and developing a plan to eliminate the root cause of any problem, avoiding re-occurring maintenance and inspection headaches.
The onstream health check mainly comprises conducting thorough and comprehensive thermographic reading of the entire unit to identify and isolate areas of refractory problems. This primarily relates to the cold wall vessels and standpipes. For hot wall standpipes and vessels, onstream thickness readings are used to establish erosion tendencies and potential corrosion area.
While the health check is a great tool for predicting problems, the mini shutdown is a great opportunity to verify those predictions, as well as discover any new potential problems. While the “mini-turnaround” (or “pit-stop”) generally does not allow any major repairs, it does allow the unit to continue to operate until the proper adjustments and repairs can take place. In general, the mini turnaround does not improve reliability, it just gives the refiner a chance to "re-do" some quick fixes that were made (unexpectedly) during the last turnaround and gives the refiner a great gauge to establish the number of expected repairs. Having the unit well mapped with a priority assigned to critical areas for inspection is key during the mini turnaround. Generally, the complete unit is not available during this time, so the inspection areas must be prioritized and planned such that the critical areas are inspected. In general, it is always good practice to have a "hit list" ready for potential inspection in the event the unit comes down for any reason during an unplanned outage (major power failure, refinery fire, feed outage, etc.). One of the most difficult predictions to make is the remaining life of equipment, so any opportunities to reduce time between turnarounds helps in the planning phase. For example, if it is known that cyclones are eroding, it is easier to judge if they can last two years until a mini-shutdown, versus having to determine if they can last four or five years until the next planned outage.
SUBHASH SINGHAL (Kuwait National Petroleum Company)
Typically, three years between turnarounds without mini shutdown is achievable. Many refiners achieve four years with mini-turnaround. If a refiner intends to achieve four years between turnaround without mini-turnaround in between, he may have reliability issues. There has been enhanced focus on improved maintenance and inspection during turnaround for better reliability.
KEVIN PROOPS (Solomon Associates LLC)
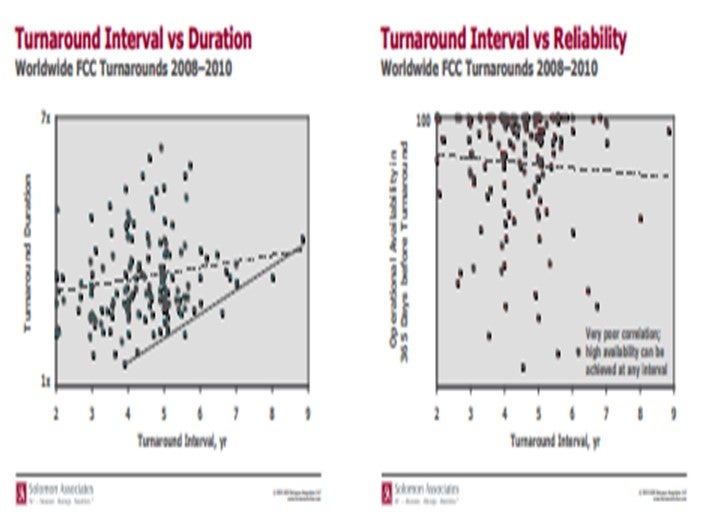
We examined worldwide FCC turnaround data from 2008 to 2010, collected in our 2010 Fuels Study. New study entrants without enough historical availability data were eliminated, leaving 162 turnarounds. We saw turnaround intervals from two to almost nine years, with a median of 4.5 years. Extending interval will increase duration, as shown in Figure 8. The best performers achieve fewer than seven annualized days down, regardless of interval. For these best performers, interval does not significantly impact the turnaround contribution to availability in our metrics. Feedstock impacts turnaround interval: RFCC units with feed above 3 wt % Conradson carbon are achieving two- to 5.5-year intervals.
HARVEY MCQUISTON (Technip Stone & Webster)
Technip Stone & Webster provided design for a major FCC revamp in a 33-day revamp turnaround. Large increases in gasoline yield obtained at the expense of slurry were seen after the modifications. After six and a half years, the cat cracker completed a very profitable run with minimal problems and was brought down for a regularly scheduled maintenance turnaround in which minor refractory repairs were performed. Upon completion of the maintenance turnaround the unit was once again producing the same yield structure seen after the unit revamp. Another very successful run is anticipated. Please refer to the paper AM-11-37 given at the 2011 Annual Meeting.
SCHOEPE (Phillips 66)
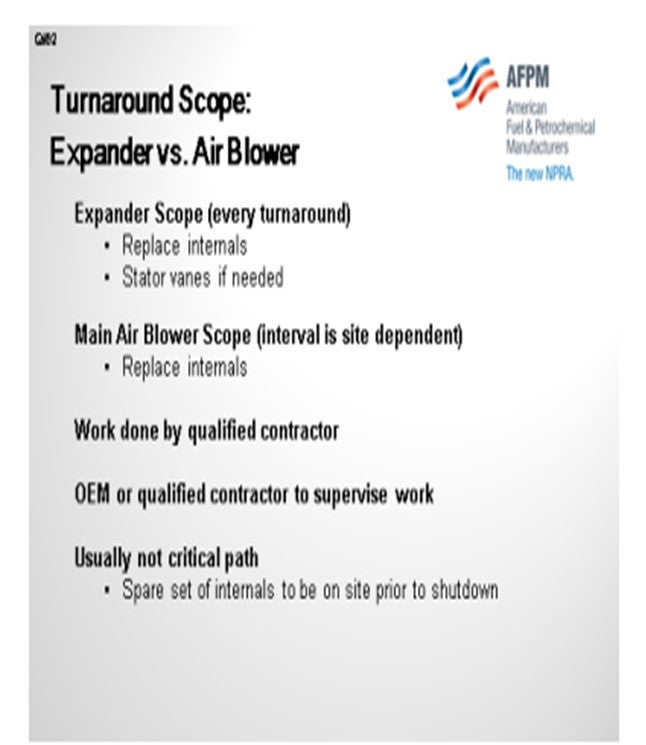
Most sites replace the internals of the expander during every turnaround. The stator veins are thoroughly inspected and replaced on as-needed basis.
In terms of the main air blower, it depends. Some sites replace all of the internals every turnaround, while other sites are managing to push the air blower overhaul to every two turnaround cycles.
Work is usually done by a qualified contractor or OEM (original equipment manufacturing) consultant. Usually, one of those people is onsite to supervise the overhaul work. It is critical to have a full set of spares onsite before you start your turnaround so that this type of work does not become critical path. Typically, critical path is set by the work that is being done in your catalyst section.
PIMENTEL (CITGO Petroleum Corporation)
I agree with Christian. In our experience, the air blower work is never on the critical path of the turnaround. In one of our refineries, we do complete overhauls every third cycle. By that time, we have already have lost our 10% efficiency in the air blower. This type of work is performed in a specialized shop outside of the refinery; and then again, it is hardly ever part of the critical path. In another refinery, we have multiple air blowers and interconnecting airlines between the FCCs, so the turnaround work is mostly limited to instrumentation, correction, changing vibration probes, testing trips, and cleaning the lube oil system. This work is performed by general turnaround contractors and, again, is not part of the critical path.
BROOKS (BP Refining)
Our response is similar to Sergio’s and Christian’s in that we have some units which overhaul this equipment every turnaround. Some pull the blower, send it out to fix everything, and replace the rotors. We have many other sites that only do it every other turnaround. We do not really have a lot that do it every third turnaround, but we do have quite a few that perform a full overhaul every other turnaround. On the off years when we are not doing a full overhaul, we will conduct similar types of inspections and basic repairs around the lube oil system. The bearing inspections, turbine and motor inspections, and testing of your safety system are essentially exactly what Sergio said. Basically, most of the work we do is driven by each site’s individual experience with their air blowers. So if their air blower has particularly poor reliability, they will tend to do more work on it. Others that have fairly reliable or redundant air blowers do not do a full overhaul every time. But for us, it rarely becomes critical path.
SCHOEPE (Phillips 66)
Expander Turnaround: All Phillips 66 units replace the internals during each turnaround. The stator vanes are being inspected and are replaced if needed.
Main Air Blower Turnaround: Depending on the reliability of the equipment, some sites service the main air blower every turnaround while others are able to service the blower every second turnaround. When serviced, the internals are replaced with spares.
If expander and main air blower are serviced, it is typical that one qualified contractor does this work. Supervision of this work is usually done by the original equipment manufacturer or a qualified third-party contractor.
To prevent this work form becoming critical path, a full set of equipment internals is usually available prior to shutdown. The critical path is usually set by the work scope in the catalyst section and not by rotating equipment maintenance.
PIMENTEL (CITGO Petroleum Corporation)
We do complete air blower overhauls every second or third turnaround, but we have found that significant capacity losses of 7% to 10%, depending on total years of operation in the blower run, occur by doing overhauls every third turnaround. This is true for an axial compressor on one FCC and a centrifugal compressor on another FCC. Work is performed in the shop of a specialized rotating equipment vendor. The presence of an expander on one of our FCCs does not alter the scope of work for the air blower.
In another refinery, we have multiple air blowers in every FCC; in addition, there is a combustion air header interconnecting all the units. Therefore, the turnaround scope for the air blowers is limited to small corrections such as changing vibration or temperature probes, cables, cleaning the lube oil system and testing trips and throttle valves. This type of job is done by the general turnaround contractors and is never part of the turnaround critical path.
BROOKS (BP Refining)
All our sites do some work on the main air blower during turnaround outages. The scope of work is slightly different per site. Some sites will do a full air blower overhaul on every turnaround because they have had significant reliability issues. Other sites focus on a list of basic repairs and inspections for each turnaround with full overhauls planned every other turnaround (typically eight- to 10-year cycles). This work scope typically includes:
• Lube oil system maintenance and flushing,
• Bearing inspections,
• Turbine and motor inspections, and
• Throttle valve trip and testing.
The scope of work on the main air blower at our sites is typically driven by each sites’ main reliability issues with the air blower. For us, this work rarely becomes critical path.
WILLIAMS (KBR)
At KBR, we specify design parameters that will allow the operator to achieve extended regenerator cyclone life for several turnaround intervals. Based on our experience, it was shown that most cyclone problems are attributed to operating above the maximum recommended velocities. KBR recommends that Operations maintain a cyclone inlet velocity below 70 fps and 80 fps for the first- and second-stage cyclones respectively.
In theory, operating at these higher velocities can lead to an increase in cyclone efficiency. However, if the velocities are above the recommended values for extended periods, the unit can experience higher catalyst attrition rates and reduction in cyclone performance.
These higher velocities tend to be the primary cause for excessive wear near the base of the cone and the dipleg entrance area. Wear in this region often leads to holes and/or gases penetrating through the refractory lining and the cyclone wall itself.
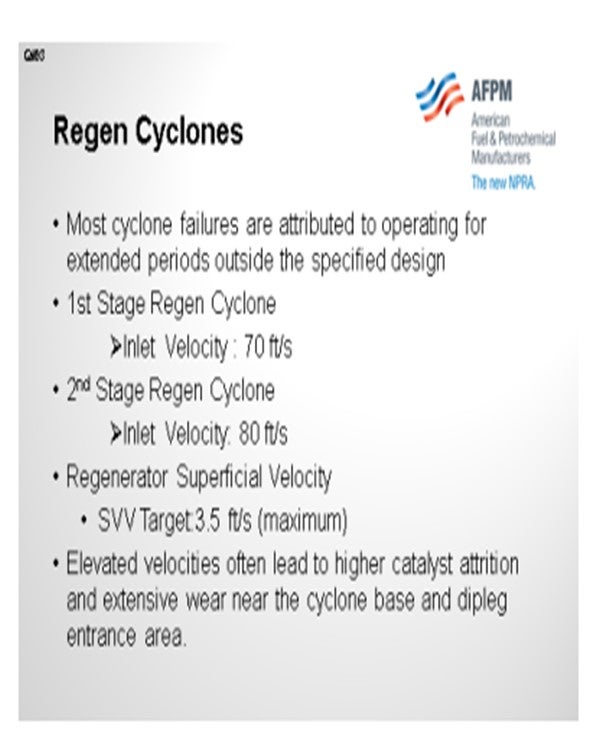
A quick fix is external metal patches – or ‘boxes’, as some people call them – or an increase of refractory thickness within this area which can allow the operator to extend the life of the cyclone set if he desires to operate beyond the recommended cyclone velocity for an extended period.
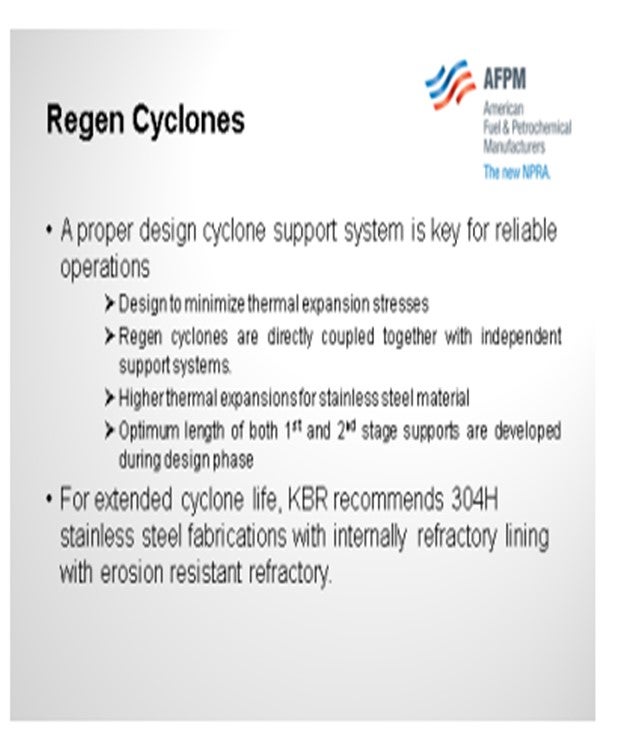
Another important design factor for the regenerator cyclones is the reliability of the support system itself. Failure to design the cyclones for minimizing thermal expansion stresses will also cause problems. Regenerator cyclones are directly coupled together with independent support systems. At elevated operating temperatures and higher thermal expansions of stainless-steel material, the regenerator cyclone supports are very critical. Therefore, it is important that the optimum length of the first stage and second-stage cyclone supports are established during the design phase.
And finally, to enhance the cyclone reliability, both cyclone sets should be fabricated with 304H stainless steel and internally refractory-lined with erosion-resistant refractory.
SCHOEPE (Phillips 66)
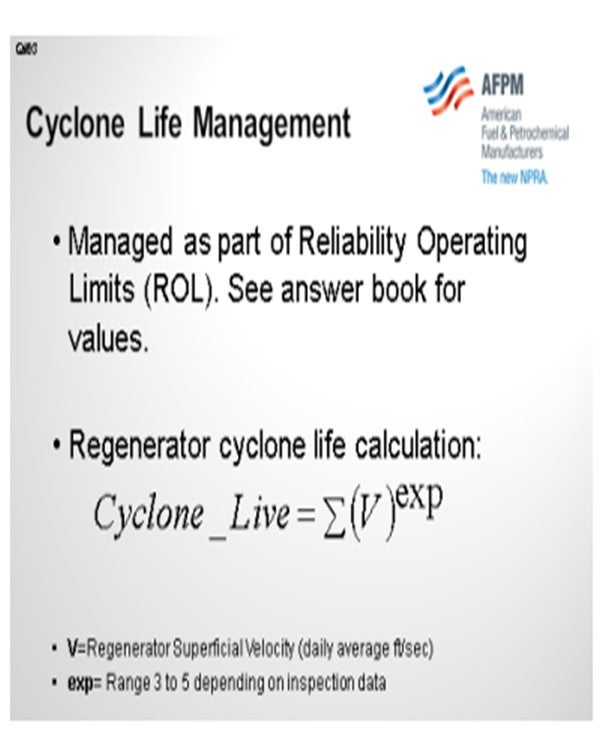
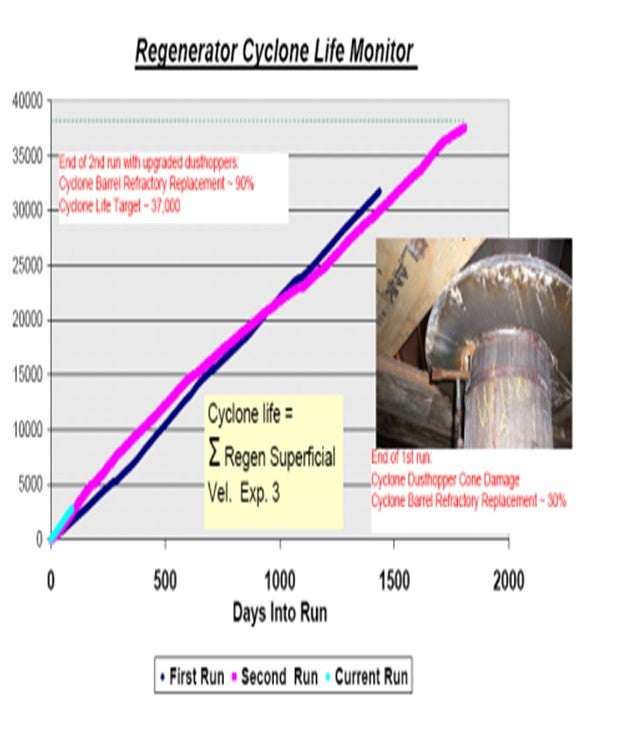
We have very similar velocity guidelines that are managed as part of our reliability operating limits. In addition, we do a monthly ‘cyclone life calculation’. There is a lot of grays on this, but it can be a useful tool to estimate the life of a cyclone that can drive changes in the refinery.
Cyclone life is a function of regenerator superficial velocity in a bubbling bed regenerator: The higher your superficial velocity, the more catalyst you will carry up to the cyclones and the faster the catalyst is going to accelerate into the cyclone and out of the cyclones, thereby increasing your erosion potential. This very simple model sums up daily averages to some exponent. The typical range for this exponent is between three and five. You use three if you have very well-built cyclones, a long cyclone L/D (length/diameter) of five, and so on. If you have old, short cyclones, you tend to use the higher number.
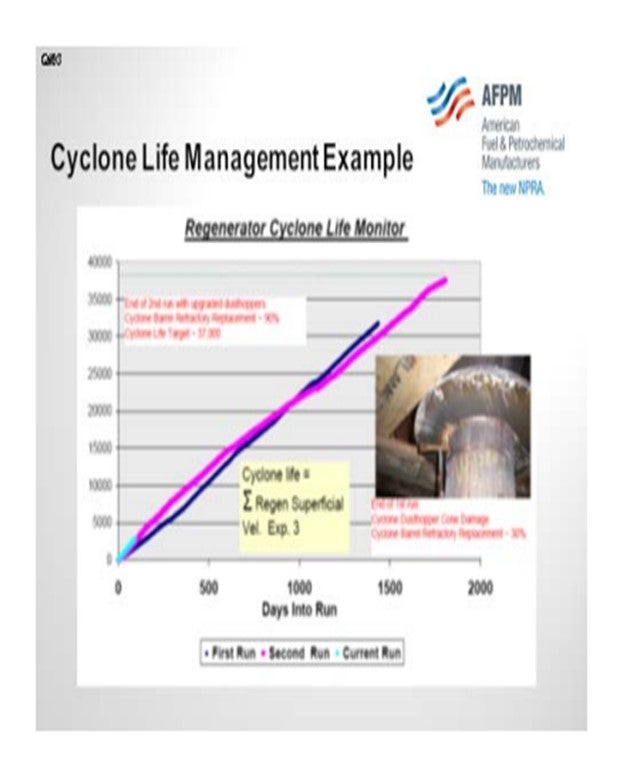
Theoretically, in an ideal world, if you had data from two runs such that when each run was ended due to cyclone failure and there were no cyclone upgrades, you could actually calibrate this exponent. But because that data is typically not available, I put together an example on the next slide which describes how we have used this model in our refinery. This unit started up in 2003. The blue line shows the sum of the daily average superficial velocity taken to the third power. At the end of that run, we saw high velocity damage: exactly the type of damage Jesse just described. If you have high gas tube outlet velocity, then the vortex extending downwards from the gas outlet tube grinds out a dust bowl. In the picture, you can see the damage on the dustbowl section. During this turnaround, we then upgraded the cyclones by installing new dust bowls that were longer and which had thicker refractory on the inside. All cyclone vendors now offer that as an option.
After the end of the first run, the unit capacity was increased by 15%. The slope of the cyclone life calculation line was much steeper. We changed the unit operation by increasing pressure, thus reducing the regenerator superficial velocity and enabling us to complete a five-year run.
You are very unlikely to reduce feed rate because of this kind of data. At the end of the second run, we had to replace 90% of the refractory. That data point is now our “end of cyclone life”. The light blue line shows our current operations.
DR. PAUL DIDDAMS (Johnson Matthey Intercat)
Is anyone using oxygen enrichment as a way of reducing superficial velocity in the regenerator to extend cyclone life?
JACK OLESEN (Praxair, Inc.)
Yes, this has been practiced in several FCC units with which I am familiar.
BROOKS (BP Refining)
I will talk more about this later, although not very much more in-depth. We actually have quite a few FCCUs with oxygen enrichment; and as I said, those sites do use oxygen enrichment to maintain a superficial velocity. We use calculations similar to what Phillips 66 uses, and we track those calculations to target our cyclone life to be in line with our inspection data. We use oxygen enrichment specifically to keep our superficial velocity down.
WILLIAMS (KBR)
At KBR, we specify design parameters that will allow the operator to achieve extended regenerator cyclone life for several turnaround intervals. Our experience has shown that most cyclone problems are attributed to operating above the maximum recommended velocity. KBR recommends that operations maintain a cyclone inlet velocity below 70 fps and 80 fps for the first- and second-stage cyclones respectively.
In theory, operating at higher velocities can lead to increase cyclone efficiencies. However, if velocities are increased above the recommended values for extended periods, the unit can experience higher catalyst attritions rates and a reduction in cyclone performance. In addition, higher velocities tend to be the primary cause for excessive wear near the base of the cone and dipleg entrance area. Wear in this region often leads to holes and gases penetrating through the refractory lining and cyclone wall. External metal patches (boxes) or increased refractory thickness within this area can allow the operator to extend the life of the cyclone set if it is desired to operate beyond the recommended cyclone velocity.
Another important design factor for regenerator cyclone's reliability is the support system. Failure to design the cyclones to minimize thermal expansion stresses will cause problems. Regenerator cyclones are directly coupled together with independent support systems. At elevated operating temperatures and higher thermal expansion of stainless-steel material, the regenerator cyclone supports are very critical. Therefore, it important that the optimum length of the first-stage cyclone supports, and the second-stage cyclone supports are established during the design phase. Finally, to enhance cyclone reliability both cyclones' sets should be fabricated with 304H stainless steel and internally refractory lined with erosion resistant refractory.
SCHOEPE (Phillips 66)
Cyclone inlet and outlet velocity and regenerator superficial velocity limits are managed as part of the Reliability Operating Limits (ROL) monitoring program. Typical values are as follows:
Regenerator:
Maximum first-stage cyclone inlet velocity:
~70 fps Maximum first-stage outlet velocity:
~75 fps Maximum second-stage inlet velocity:
~85 fps Maximum second-stage outlet velocity:
~140 fps Maximum regenerator superficial velocity (bubbling bed regenerator): ~3.4 fps
Reactor:
Maximum first-stage cyclone inlet velocity:
~70 fps Maximum first-stage outlet velocity:
~75 fps Maximum second-stage inlet velocity:
~85 fps Maximum second-stage outlet velocity: ~110 fps
These limits are, however, adjusted to individual units based on inspection history.
For second-stage regenerator cyclones, a cyclone life calculation is often done. This simple mathematical model applies to negative pressure cyclones and needs to be calibrated using historic inspection data. Since cyclone life is proportional to gas velocity and catalyst loading, regenerator superficial velocity is used to calculate a “cyclone life number”. As the regenerator superficial velocity increases, the gas and catalyst load into the cyclones increases and vice versa.
For a rigorous calibration of the exponent, data from at least two runs that ended in cyclone failure has to be available. The cyclone repair at the end of these runs cannot include cyclone upgrades. Often, there is not enough data available for such a detailed calibration. The example below shows how a value for cyclone life can be established.
Example: The newest Phillips 66 FCC unit started up in 2003. After the first run in 2007, high velocity cyclone damage was discovered on the second-stage regenerator cyclones. All cyclones had thinning and holes on the dust hopper cone outlet. In addition to this damage, about 30% of the refractory in the cyclone barrels had to be replaced. The damaged dust hoppers were replaced with longer dust hoppers with thicker refractory. Five years later at the end of the second run, about 90% of the refractory in one of the six second-stage cyclones barrel/main cone area had to be replaced. The new dustbowl design did not show any sign of catalyst erosion after five years of operation. Given the level of damage in this cyclone, the “cyclone life number” for this unit is about 37,000 using an exponent of three.
BROOKS (BP Refining)
BP uses cumulative velocity calculations for estimating our cyclone life also. Our calculations are similar to those described by Phillips 66 and are correlated to historical inspections on each unit. Some of our units that track this calculation will use oxygen enrichment if available to maintain operations within the superficial velocity targets based on this calculation.
SCHOEPE (Phillips 66)
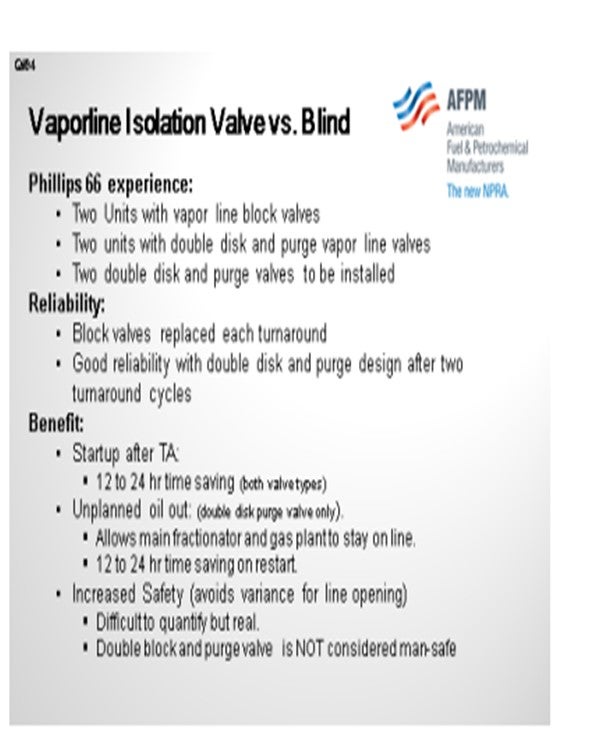
We have quite a few units that use valves in the vapor line and others with just simple blocked valves in that service. Two more units now have a newer style: a double disc valve which relies, in part, on a steam purge to provide positive isolation. Because that valve was very successful, two more valves are going to be installed soon.
In terms of reliability, the blocked valves need to be replaced every single turnaround. They are coked-up after start-up and cannot be used again during the run. We have had good reliability with the newer type of valve. Some of those valves are now being refurbished after two runs.
Justifying the benefit of such a valve: You can save anywhere from 12- and 24-hours during start-up. After this slide, I have two more slides that drive home this point. Another advantage is that because the FCC gas plant is often used as a garbage dump for the rest of the refinery, if you do have an outage, you can actually isolate your catalyst section from the main fractionator and keep the recovery section online while doing repairs in your catalyst section. If your site had issues with safety while removing the vapor line blind, such a valve is easily justified. If safety is not deemed justifiable for undertaking this project, then it may be challenging to find another justification. The newer style, the double block and purge valve, is not considered a man-safe device because it relies on a steam purge for positive isolation. All of these newer valves are now being sold with a blank upstream of the valve, which you can then install to make the isolation man safe.
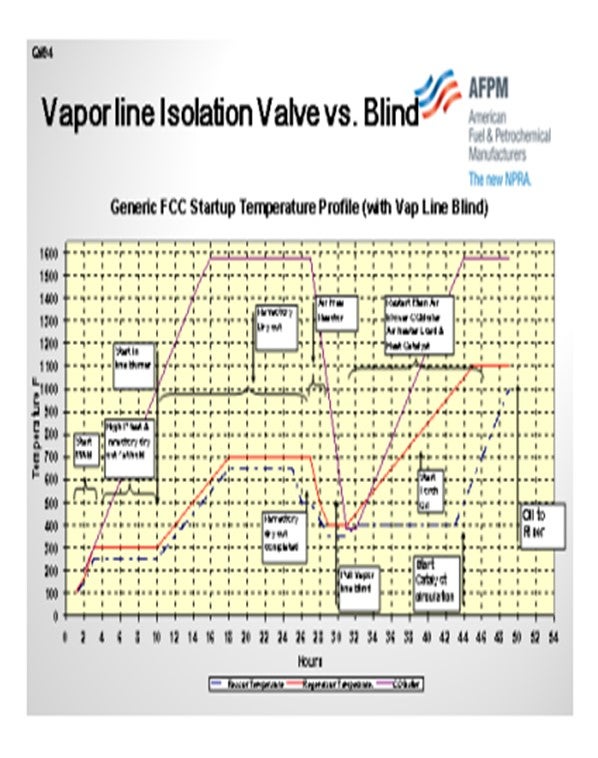
Going back to the justification: A good way to explain the benefit of this valve is to show an FCCU heat-up curve after turnaround. The red line represents regenerator temperature. The blue line is your reactor temperature, and the magenta line is your CO boiler temperature, if you have one. You start your air blower and then go into your first hold for refractory dryout. At some point, you will start your inline air heater; then, you will increase temperature to your next hold point. The heat-up reactor is lagging the regenerator by about 100ºF. First, the reactor and regenerator are being dried out with air. After the second hold period, the refractory dryout is finished.
In preparation to pull your vapor line blind, the reactor is air-freed, which takes about an hour or so. During that time, other equipment needs to be shut down. The CO boiler is usually shut down, in addition to the inline burner and main air blower. After that, the vapor line blind is pulled. With the vapor line blind taken out, the CO boiler, main air blower, and inline burner are restarted.
The next slide shows the time savings if you do have a vapor line valve. After the refractory dryout, you do not have to shut down anything. You keep your air blower and CO boiler running, and then proceed directly to catalyst loading.
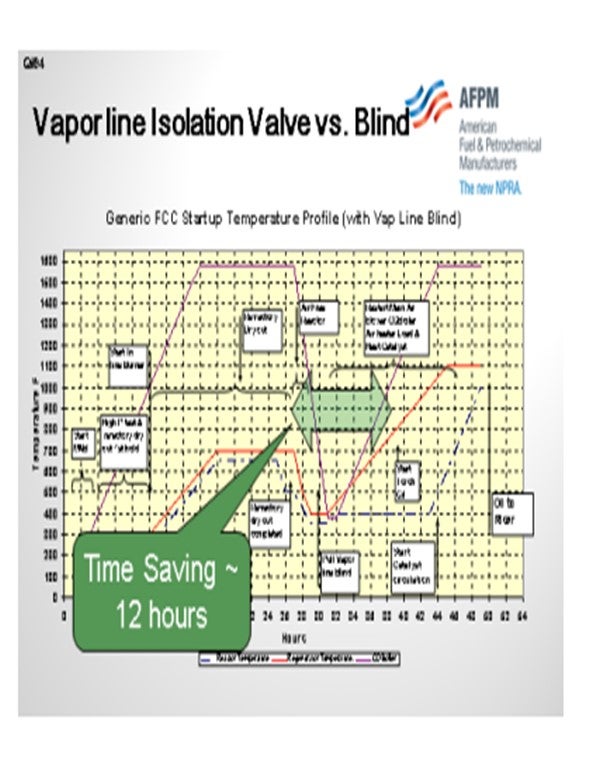
In summary, it is very difficult to justify such a valve if you are not allowed to consider safety and only allowed to consider scheduled plant turnaround intervals. If, however, you consider one unplanned event during each run, it will be very easy to justify that type of device.
LALL (UOP, A Honeywell Company)
Christian covered this very well. UOP also does not consider the isolation valve to be man-safe for vessel entry. Therefore, an isolation blind will need to be installed whether the valve is installed or not.
WILLIAMS (KBR)
I have nothing more to add.
MICHAEL LEMESHEV (Zimmerman & Jansen)
With regard to these valves, here is some statistical data. In North America, there are about 99 cat crackers. Not including refineries, FCCs and Flexicrackers total 140 units, plus 11 in Mexico. There are probably 22 to 23 cats with these types of valves ranging in size from 24 inches to 66 inches. In addition, speaking from the safety side, which UOP has addressed very well, the valves are installed with manual actuation. They are not using any kind of automated actuation, and that addresses some of the safety aspects of the installation. In this way, the automated line blank can be compared to a regular line blank, in terms of an accidentally swinging blank. Now this obviously would not happen. Additionally, the valves can be fitted with a safety mechanism that would prevent them from being stroked or, even in the event of stem failure, the gate slamming shut on its own due to gravity. These are some of the considerations when evaluating the configuration of the valve. These points help address the safety aspect and also give some basic numbers about how many refineries have these valves installed.
LALL (UOP, A Honeywell Company)
We do have a number of customers that use these and contemplating their use. The benefit depends on the type of start-up procedure that the refiner follows. If a "blind out" procedure is normally followed where the entire unit is cold when the blind is removed, the addition of the valve can save a few days of downtime, especially for a new unit. If a "blind in" procedure is normally adopted where the equipment is hot and under steam purge, there are the added benefits of personnel protection and safety. UOP views the reaction vapor line isolation valve as a safety-oriented valve more so than a production saving valve. However, one needs to bear in mind that the valves are expensive. Also, this is a judgment call by the refiner who will assess its merits on safety grounds and/or production time gains.
In our experience, the isolation valve does operate without any problems following turnarounds (i.e., when the valves are cleaned and overhauled); however, whether the valve works dependably after exposure to hydrocarbon is another matter. Feedback from customers has generally cited problems with coke lodging in the cavities of the housing, securing a tight closure during the previous shutdown, and purging the valve. UOP believes the valve vendors are working to enhance the reliability/availability of the valves.
UOP does not, however, consider the isolation valve to be man-safe for vessel entry. The isolation valve typically requires an internal purge to keep the inner housing cavity free of hydrocarbon and this cannot be considered to be safe for vessel entry. Therefore, an isolation blind will need to be installed no matter if they install the valve or not. This may limit the usefulness of the valve.
SCHOEPE (Phillips 66)
Phillips 66 FCC units use two types of valves in the vapor line from the reactor to the main fractionator, a simple block valve and, in recent times, a double disc steam purged isolation valve. Block valves can only be used once during start-up. During the run, these valves coke up and need to be cleaned and/or replaced during each shutdown. Maintaining such a valve is justified by shortening the start-up time between refractory dryout and catalyst loading. An overhead vapor blind allows the refiner to proceed directly from air-freeing the reactor to catalyst loading, units without an overhead vapor valve have to prepare for pulling the overhead blind by shutting down the main air blower, the in-line air heater and the CO boiler (if applicable). After the blind has been pulled, the unit has cooled down significantly and all previously named equipment has to be restarted in order to continue with the start-up process. Depending on the site and the reliability of the equipment, an overhead valve saves one to two shifts during unit start-up.
A newer style double disc and purge valve has all the advantages of a simple block valve, but it can also be used during a run and at the end of each run. Overall reliability for these valves has been good within the Phillips 66 organization. Some valves are now being refurbished after two turnaround cycles.
The economic justification for such a valve is difficult if only planed turnaround intervals are considered. If one or two unplanned outages are used in the economic evaluation, the Lost Profit Opportunity (LPO) is usually high enough to justify such an investment. Line opening during the removal and installation of a vapor line blind can be hazardous and has to be managed very carefully. The increased safety during FCC start-up often contributes the justification of a vapor line valve. Because the double disc and purge design relies in part on a steam purge to provide positive isolation, most sites do not consider this isolation device “man safe”. All newer double disc and purge valves are, therefore, sold with an additional blind/spacer, which is located upstream of the valve.
WILLIAMS (KBR)
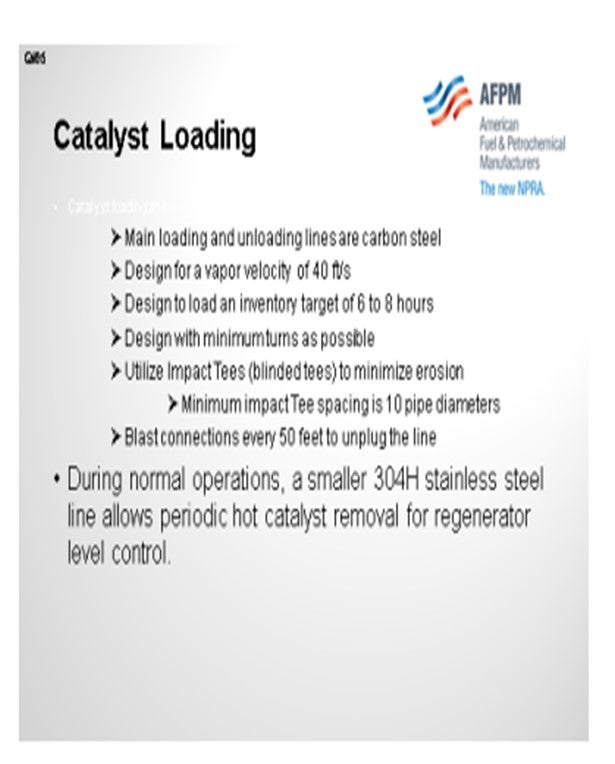
KBR’s Best Practice is to fabricate the main catalyst loading and unloading lines with carbon steel. To protect the carbon steel lines against elevated regenerator temperatures, KBR recommends that Operations personnel only de-inventory the converter after the catalyst has been cooled below 650°F. The main catalyst loading and unloading lines are sized for an approximate vapor velocity of about 40 fps, and an inventory loading target of about 68 hours.
We also equipped the unit with a smaller 321H stainless steel line utilized to unload hot catalyst during normal operation for regenerator inventory or level control. For optimum loading, KBR targets shorter carrier length links with the least turns possible. Impact Ts or blinding Ts are used for the turns to protect the piping elbows from erosion. These Ts are properly spaced at least five to 10 diameters apart to minimize line pressure drops. Finally, we also equipped the line with one-inch blow-out connections, which are placed every 50 feet, to blast the unloading piping in the event the line becomes blocked.
LALL (UOP, A Honeywell Company)
In general, I am in agreement with the comments made by KBR. We differ in that UOP’s standard piping metallurgy for handling hot catalyst from the regenerator is low chrome. As part of that system, we have a finned, low chrome piping section of approximately 100 feet provided downstream to enhance the heat transfer, which permits hot catalyst removal. We then switch to killed carbon steel for the piping to the hopper. Several skin thermocouples are installed along the piping system to assist in the monitoring of the catalyst withdrawal rate.
PIMENTEL (CITGO Petroleum Corporation)
I have nothing to add on the piping design. I want to say that it is important to have significant pressure in your plant air system over the internal regenerator pressure in order to avoid any backflow. You should also design your system to accommodate for the consumption peaks typically associated with the loading or unloading catalyst trucks. Inadequate air supply will result in hot catalyst backflow to the air pipes.
AVERY (Albemarle Corporation)
Catalyst loading and unloading lines are generally fabricated from carbon steel. Some refineries have used or added finned piping to portions of these lines if the catalyst withdrawal system is continuous or almost continuous. Aeration taps are typically installed every 22 feet to maintain sufficient carrying air to transport the catalyst. It is essential that the carrying air be dry. Most systems employ long radius bends to make turns, but several have used Ts at the transition for horizontal to vertical.
Cleanout connections are located at strategic points along the system. T cleanouts are needed to clear catalyst from portions of the piping, particularly the vertical sections, if aeration is lost. Otherwise, carrying air will is lost, thereby allowing the catalyst to settle. As the catalyst reaches the internal angle of friction, it is virtually impossible to blow the catalyst out of the line. Run lengths will depend on the location of the catalyst hoppers relative to the regenerator.
KEVIN PROOPS (Solomon Associates)
I want to comment on Jesse’s response. I am familiar with a regenerator with a 300 series stainless steel withdrawal nozzle which cracked due to polythionic stress corrosion cracking. It then fell off the regenerator and caused an unplanned shutdown.
AVERY (Albemarle Corporation)
We have not experienced any of that. To my knowledge, our systems have been very reliable, but it is great that you added that to the conversation.
ROBERT KURTAS (Hess Corporation)
In the continuous withdrawal system, what type of valves do you use that do not erode away?
SCHOEPE (Phillips 66)
At our refinery, we have actually experimented with a new type of valve. I am not supposed to be specific, but it is a boiler valve. There is a different manufacturer in Houston who also fabricates a very reliable ball valve. Some of these ball valves eliminate the air purges. Most of the erosion I have seen has really been caused because operators forgot to turn off the aeration to the stem seat and stem. We had huge problems with that until we changed operating practices to allow you to turn off your catalyst aeration air whenever you are not using your unloading line.
MARTIN EVANS (Johnson Matthey Intercat)
We have quite a lot of experience putting addition systems into newly built FCC units and helping people design their catalyst addition lines. I agree with everything that the panelists have said and want to add a few thoughts.
In a lot of newly built FCCs, we have seen the E&C (Engineering and Construction) contractors requiring Schedule 160 pipe and 300-pound flanges on catalyst addition lines. To me, that is total overkill. We have been using Schedule 80 pipe with 150-pound flanges for over 20 years, and we still have systems out there that are working perfectly fine.
One of the biggest problems I have notice with catalyst withdrawal piping is that most catalyst withdrawal lines are designed to allow the regenerator to be de-inventoried for a shutdown, but they are not designed for continuous withdrawal on the run. So what usually happens is that you have a 6-inch or an 8-inch line. You try to withdraw small amounts of catalyst every few days down that line, but it is just not designed for that service.
With our new catalyst withdrawal system, we are using a 1.5-inch diameter withdrawal line, which sounds incredibly small. But actually, you can get over 30 tons a day down that line in continuous withdrawal mode. So, you do not need a very big pipe if you are doing continuous catalyst withdrawal.
WILLIAMS (KBR)
KBR’s Best Practice is to fabricate the main catalyst loading and unloading lines with carbon steel. To protect the carbon steel lines against the elevated regenerator temperatures, KBR recommends operations personnel only de-inventory the converter after the catalyst has cooled below 650°F. The main catalyst loading and unloading lines are sized for an approximate vapor velocity of 40 fps and an inventory loading target of six to eight hours. A smaller 321H stainless steel line is utilized to unload hot catalyst during normal operations for regenerator inventory (level) control.
For optimum loading, KBR targets shorter carrier lines lengths with the least turns possible. Impact Ts (blinded Ts) are used for turns to protect piping elbows from erosion and are properly spaced at least 10 pipe diameters apart to minimize line pressure drops. Finally, one inch blowout connections are placed every 50 feet to blast the unloading piping in the event the line becomes plugged.
PIMENTEL (CITGO Petroleum Corporation)
In addition to the design aspects of the catalyst lines, it is important to ensure good supply of air to prevent catalyst back-flow. Our standard is to provide a minimum of 20 psi of pressure over the internal unit pressure (standpipe or regenerator), and design the system to support other activities that could potentially affect the local plant air pressure; such as loading or unloading catalyst from the unit hoppers to trucks.
AVERY (Albemarle Corporation)
Catalyst loading/unloading lines are typically fabricated from carbon steel. Some refiners have added finned piping to portions of these lines if the catalyst withdrawal system is continuous or almost continuous. Aeration taps are installed every 20 to 30 feet to maintain sufficient carrying air to transport the catalyst. It is essential that the carrying air be dry. Most systems employ long radius bends to make turns, but several have used Ts at the transition from horizontal to vertical. Cleanout connections are located at strategic points along the system. T cleanouts are needed to clear catalyst from the portions of the piping, particularly the vertical sections, if aeration is lost, or carrying air is lost and catalyst is allowed to settle. As catalyst reaches the internal angle of friction, it is virtually impossible to blow the settled catalyst out of the line. Run lengths will depend on the location of catalyst hoppers relative to the regenerator.
LALL (UOP, A Honeywell Company)
The following criteria are used by UOP for design of the catalyst bulk loading (filling) line to the regenerator and unloading line for complete de-inventory:
a) Catalyst loading and withdrawal lines are normally sized to a catalyst flux criterion based on less than 75 lb/ft2 -s (pounds per square foot per second) and a velocity of 30 fps to 40 fps.
b) Blast connections are located every 40 feet of catalyst pipe run.
c) The piping metallurgy for handling hot-catalyst from the regenerator is 1¼ Cr – ½ Mo (molybdenum) Class 300#.
d) Killed carbon steel class 300-pound rating is specified for piping section that operates below 400°C.
e) Double block valves located close to regenerator shell in each main withdrawal line. The one installed at regenerator nozzle shall be only operated in the fully open or fully closed position. The second valve can be used to “control” the catalyst transfer rate (note regulating the hopper pressure to limit the catalyst withdrawal rates greater enhances the longevity of the valve in this case).
f) All gate valves have plant air purge connections at the bonnet and seat to prevent ingress of catalyst and allow full opening/closure of the valve.
g) A finned piping section [approximately 25 m (meters) to 30 m] is provided downstream of normal catalyst withdrawal. A bulk unloading/loading branch connection is installed to enhance heat transfer and assist in reducing catalyst temperature from dense bed condition.
h) Several skin thermocouples are installed along the piping system to assist in monitoring the catalyst withdrawal rate.
Catalyst lines to and from catalyst storage hoppers and vacuum cleaning header shall be designed to meet the following requirements:
a) Changes in direction shall be made with pipe bends or Ts, as specified on the P&IDs. When long radius bends are specified, pipe bends shall have a radius between 9 and 18 (preferred) diameters of pipe (long radius elbows in the catalyst withdrawal line and catalyst filling and withdrawal line running to the hoppers are no longer specified by UOP and have been replaced with blind or hard Ts as these prove to be more durable).
b) Grind smooth the welds inside of pipes for butt-welded piping system. The slag and debris can obstruct catalyst flow.
UOP’s designs also incorporate a continuous catalyst withdrawal system for high catalyst users. Continuous catalyst withdrawal, in combination with continuous catalyst makeup, allows the catalyst inventory to be minimized and better catalyst activity maintenance. A continuous plant air purge used to maintain the catalyst fluidized also promotes higher heat transfer. An automatic valve (Everlasting, mogas, or equivalent) operates in an on/off mode to modulate the catalyst transfer from the regenerator to the catalyst hopper. The time intervals in the open and closed position is determined from actual operation experience based on mass of catalyst to be transferred, available pressure driving force, regenerator temperature, heat transfer rate with installed piping, and the return temperature to the spent or equilibrium hopper.