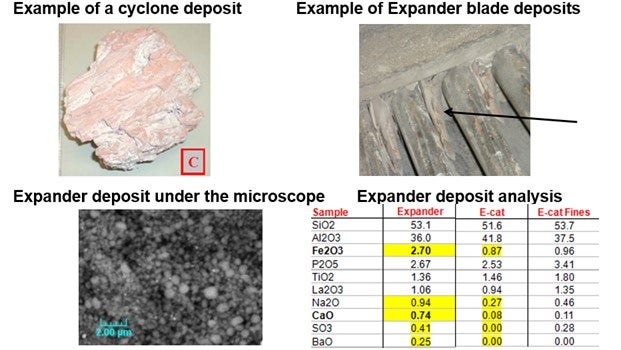
FEDERSPIEL (W.R. Grace & Co.)
With the next few slides, I will show you some data we compiled. I will explain the data as I talk through the slides. On the first slide are histograms of data that is sent to us from FCC units of both Grace customers and non-Grace customers. Each unit is represented by one number. Looking at the number of units on the Y axis, you see that they are grouped into different contamination levels. The histogram shows globally where we have received data for the year 2017 and also gives you an idea of the distribution of those contaminants across the industry.
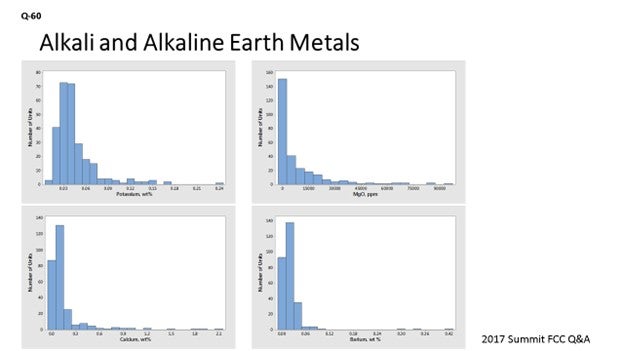
The question asked: With these new types of feeds that are coming in, what new metal contaminants are we seeing? At Grace, we have broken them down into three different types of groups. We group it out as alkaline and alkaline earth metals, which went into the potassium, magnesium, calcium, and barium. They tend to act similar to sodium in that they will ultimately destroy zeolite. And then at high enough concentrations, they can help aid the forming of eutectics, which can further degrade access to the catalyst diffusion to the catalyst sites or even cause service and more morphology problems.
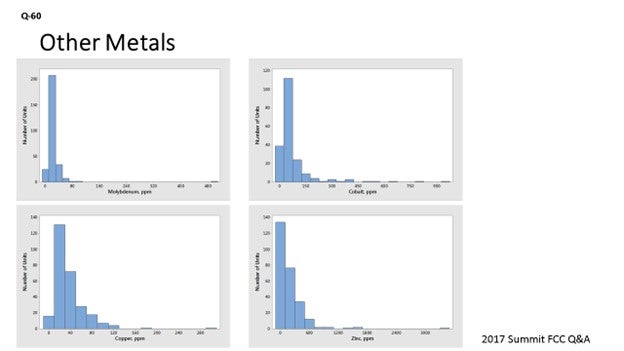
There are other metals which we classify such as molybdenum, cobalt, copper, zinc, and lead. These metals often act with dehydrogenation effects similar to nickel and vanadium. So, they are tied, again, to the traditional metal contaminants we have been studying for a while. Molybdenum is interesting in that it is particularly destructive but not particularly common. If you look at the distribution of units, you see that not very many units have any kind of real concentration of molybdenum on them, but that molybdenum is said to be five to 10 times dehydrogenating as nickel and vanadium. However, the concentrations are so little that they do not really impact FCC unit performance.
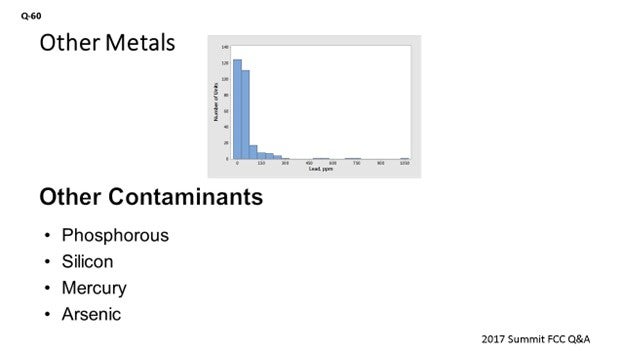
Lead is one of those metals that has been around. It is known to reduce promoter effectiveness, even at levels of around 100 ppm. But if you build up lead, you can start to impact the activity of the catalyst when the lead reaches levels around 800 ppm. And again, by looking at the distribution, you can see that there are just not many units out there with very high concentrations of lead, at least in the activity reduction zone. There are a few where the lead could be impacting the promoter effectiveness. We do see other elements – including phosphorous, silicon, mercury and arsenic – present in FCC e-cat (equilibrium catalyst).
With respect to the time, I will just quickly talk about arsenic. It is interesting because depending on how the lab that you are using is analyzing for it, you can actually get a false positive or a false high result. The reason is that the method can confuse lanthanum, which is present on FCC catalyst, as arsenic because the peaks are overlapped. So, there is a specific type of ICP (inductively coupled plasma) mass spectroscopy that you should be using if you are trying to analyze for arsenic, which is present in some crudes and imported feedstocks. Arsenic can produce some bad downstream effects.
DINKEL [Marathon Petroleum Corporation (MPC)]
I will just confirm our experience from Mike’s laundry list of contaminants. We have seen some barium show up in units that process tight oil, but the concentrations were so low that we did not see any impact to unit operation.
ALEXIS SHACKLEFORD (BASF Corporation)
For barium, BASF has done some laboratory tests looking at the impacts. As long as there is a rare-earth on the catalysts, the impacts are minimal, if any. Silicon normally comes from the coke unit (recycle) due to the antifoams used. FCC catalysts already contain a high amount of Si, and additional Si (silicon) will have no impact. You do not have any of the concerns you would for hydrotreating. Now, arsenic is volatile under FCC conditions. Due to its volatility, it does not deposit on the catalyst and has no negative effects. You will see it downstream in the propylene steam as they both have similar boiling points. If your propylene stream is routed to any chemical operations, you must remove that arsenic because it will kill the catalysts. There are plenty of solutions for arsenic removal in these streams.
MICHAEL FEDERSPIEL (W.R. Grace & Co.)
In addition to the “standard” contaminants of nickel, vanadium, iron, and sodium, there are a variety of other feed contaminants that can impact FCC performance. For example, tight oils (also known as shale oils) can contain high levels of potassium, magnesium and calcium in addition to the iron normally found in them8. While bio-based feedstocks are not yet widely processed in commercial units, they would be expected to contain higher levels of calcium, sodium, magnesium, and potassium than conventional feed sources since these elements all play an important role in biological systems. High levels of phosphorous have been found on synthetic crudes. Opportunity crudes can contain a variety of non-standard metals including copper, zinc, silicon, mercury, and arsenic. Molybdenum and cobalt can also find their way into FCC feedstock. At times, it seems like every element in the periodic table can wind up in the FCC.
These metals can be considered in three groups: (a) alkali and earth alkaline metals, (b) other metals, and (c) other contaminants. For many elements, histograms of contaminant levels on e-cat are presented. These histograms are based on a worldwide survey of more than 270 FCC units, and the data is a one-year average for each unit of the e-cat samples tested.
Alkali and Earth Alkaline Metals
Similar to sodium, the alkali metal potassium will reduce activity by poisoning active sites and will also result in zeolite destruction. Alkaline metals in feed (such as calcium, magnesium and barium) will result in zeolite degradation similar to that seen with sodium. Classic work by Letzsch and Wallace9 found that on an added weight-percent basis, potassium is about 0.5 to 1.0 times as destructive as sodium and that calcium and magnesium are less destructive than sodium. Barium was found to be less destructive than the other alkaline earth metals. Calcium, in combination with iron, can be especially detrimental. As described in the answer to Question 44 at the 2009 NPRA Q&A, calcium – along with other elements such as iron and sodium – can act as a fluxing agent to form low melting-point phases on the surface of the catalyst. This could help the operation results in the collapse of the pore structure on the surface of the catalyst particle and a reduction in conversion since it is harder for feed molecules to enter the catalyst particle. As seen in Figure 1, levels of potassium on equilibrium catalyst are generally low, with the worldwide average at 0.05 wt% (weight percent).
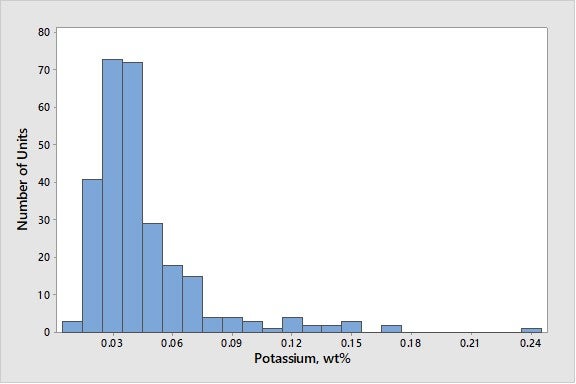
Figure 1. Average Concentrations of Potassium on E-Cat for FCC Units Worldwide
This level on e-cat contrasts with sodium which has an average level on e-cat of 0.26 wt%. Most magnesium in equilibrium catalyst comes from SOx-reduction additives or metals-trapping components instead of feed. Figure 2 presents a histogram of magnesium oxide concentration in e-cat for units worldwide.
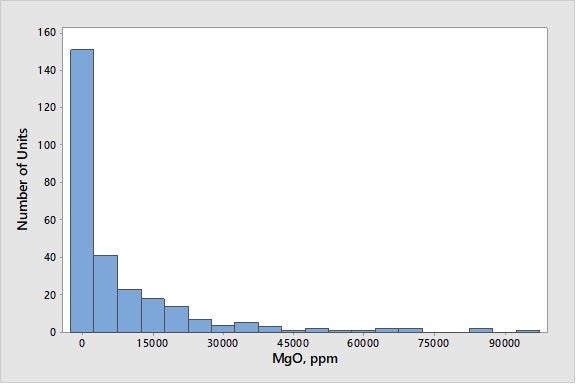
Figure 2. Average Magnesium Oxide Concentrations on E-Cat for FCC Units Worldwide
Calcium can come from feed, although there are a few units that use calcium containing additives. As seen in Figure 3, more than 90% of the world’s FCC units run at calcium levels below 0.5 wt% on e-cat.
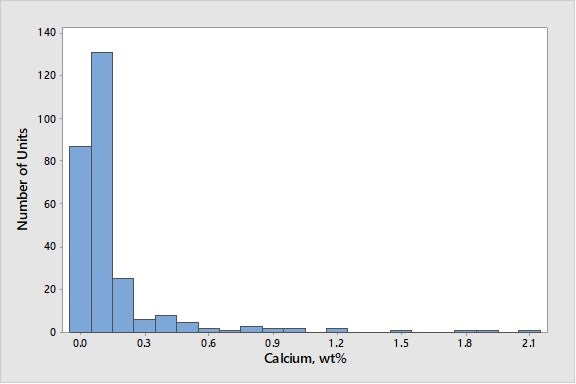
Figure 3. Average Calcium Concentrations on E-Cat for FCC Units Worldwide
As seen in Figure 4, barium levels are generally low, with 95% of the world’s FCC units at barium levels below 0.1 wt% on e-cat.
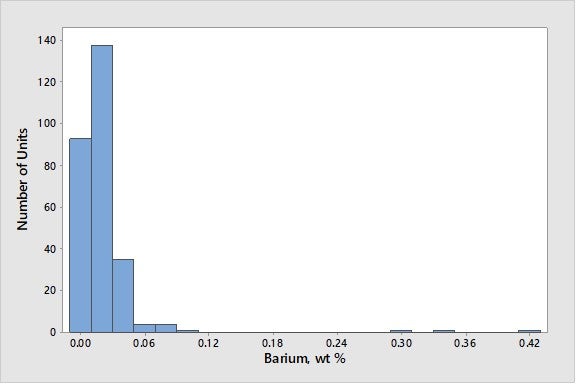
Figure 4. Average Concentrations of Barium on E-Cat for FCC Units Worldwide
Other Metals
Many metals (like molybdenum, cobalt, copper, and zinc) act as dehydrogenation catalysts, like nickel and vanadium. Molybdenum is a rare feed contaminant that can cause zeolite destruction, as well as an increase in coke and hydrogen. It can be present in feed either from the starting crude oil or from carryover of hydroprocessing catalyst. While cases of molybdenum poisoning are rare, it can have a very detrimental effect. In one refinery, a severe increase in molybdenum, by 1700 ppmw (parts per million by weight), resulted in a six-number drop in e-cat MAT (microactivity test) – a tripling of the e-cat gas factor – and a more than 50% increase in the e-cat coke factor. In another refinery, an increase in molybdenum from 40 to 180 ppmw resulted in the doubling of hydrogen production in e-cat testing. While the detrimental effects of molybdenum will vary with regenerator conditions (full-burn versus partial-burn and temperature), as a rough approximation, molybdenum appears at least five times as active as vanadium on a weight basis. Fortunately, molybdenum is a rare contaminant in most units. As seen in Figure 5, with the exception of one unit, molybdenum levels on e-cat are below 100 ppmw.
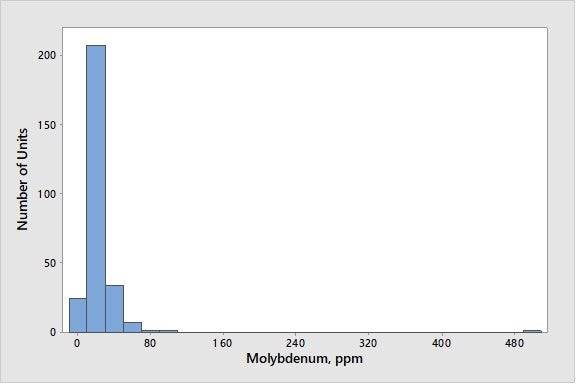
Figure 5. Average Concentrations of Molybdenum on E-Cat for FCC Units Worldwide
While cobalt is not typically found in the feed unless it comes in from hydrotreaters ahead of the FCCU, it can result in increased hydrogen and coke. As seen in Figure 6, cobalt levels are generally low, with 90% of the world’s FCC units at cobalt levels below 200 ppmw.
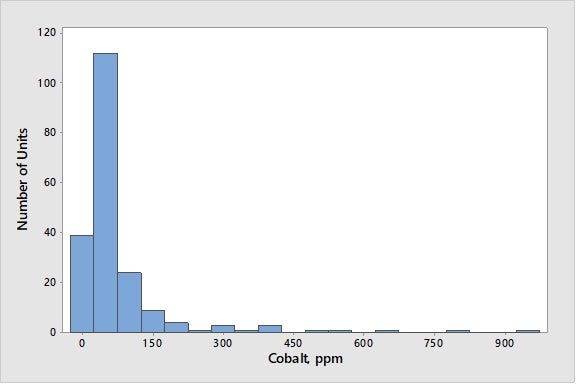
Figure 6. Average Concentrations of Cobalt on E-Cat for FCC Units Worldwide
The dehydrogenation activity of copper is typically about the same as that of nickel on a weight basis10. The copper content of most FCCU feeds is very low, so it is normally not a problem. As seen in Figure 7, copper levels are generally low, with 95% of the world’s FCC units at copper levels below 100 ppmw.
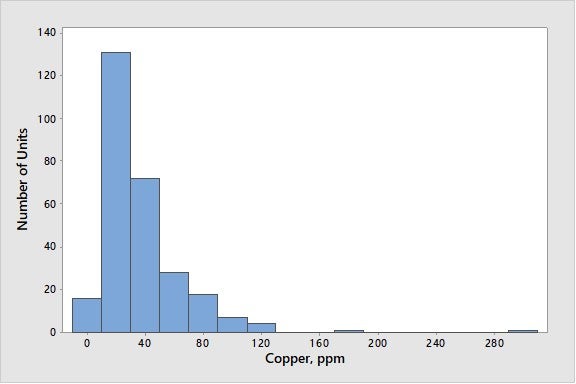
Figure 7. Average Concentrations of Copper on E-Cat for FCC Units Worldwide
Zinc from feed is another metal with dehydrogenation activity. In a 1996 NPRA Q&A, one respondent to Question 18 (about processing used lube oils) stated that he had found that zinc tended to have lower dehydrogenation activity than nickel. We have observed several North American units experience spikes of zinc on e-cat of 1,000 to 2,000 ppmw in the last two years, possibly from zinc additives in their crude slate. In addition to coming from feed, zinc is used in some gasoline sulfur-reduction additives; zinc from this source will also appear on e-cat reports. Zinc in gasoline sulfur-reduction additives does not have the dehydrogenation activity of zinc introduced from feedstock. Figure 8 presents average zinc levels on e-cat worldwide with known zinc-based GSR (gasoline sulfur reducing) additive users removed. As seen in Figure 8, 90% of FCC units have less than 500 ppmw zinc on e-cat.
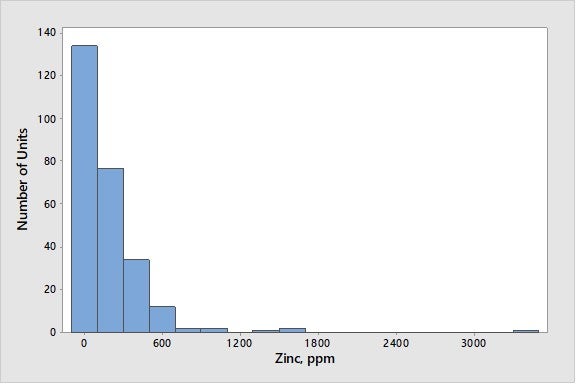
Figure 8. Average Concentration of Zinc on E-Cat for FCC Units Worldwide (with known Zinc-based GSR Additive Users Excluded)
Lead can come from the source crude oil or – very rarely – from recycled aviation gasoline slop streams fed to the FCC. It is well known that lead can cause the deactivation of combustion promoter, which results in detrimental effects at levels of even 100 ppmw11. Work in 1987 established that in large enough concentrations on e-cat, lead can also cause a loss in catalyst activity and conversion. In that work, 800 ppmw lead resulted in a loss of 2 to 4 numbers of MAT activity12. Experience with equilibrium catalyst suggested that 1,000 ppmw lead would result in a loss of 1% conversion13. However, there are almost no units operating at these levels of lead in the industry today. Nine five percent of units are below 300 ppmw lead on e-cat, and 85% of units are below 100 ppmw lead on e-cat. Figure 9 presents industry average data for lead on e-cat.
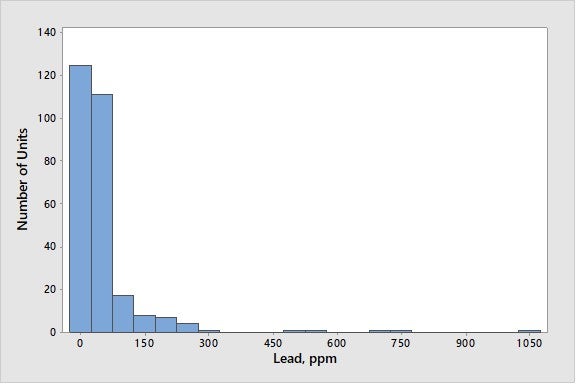
Figure 9. Average Concentrations of Lead on E-Cat for FCC Units Worldwide
Other Elements
High levels of phosphorous can be found in shale oils and in Western Canadian crudes. The phosphorous appears to come from fracking fluids and gelling agents used in well stimulation. In our experience, we have seen P2O5 (phosphorus pentoxide) on e-cat increase by up to 0.1 wt% with a change in FCC feedstock slate. The levels are not high enough to affect FCC catalyst, but the phosphorous is often a problem in the main fractionation tower and the hydrotreater. Questions 31, 36, and 65 from the 2013 AFPM Q&A address the effects of phosphorous in units other than the FCC.
Silicon can come from crude oil or antifoaming agents. Since silicon oxide is present in the composition of the base catalyst, we would not expect silicon from feed to have an effect on FCC catalyst and have not observed any effects. However, silicon is a significant poison for hydroprocessing catalysts. This topic has been discussed in earlier AFPM Q&A and Technology Forums14.
Mercury can be found in trace levels in many hydrocarbons. Under FCC conditions, mercury is very volatile and would not be expected to build up on FCC catalyst. While mercury would not affect FCC catalyst, it can concentrate in cooler downstream units. For example, there is a reported case of pooled mercury having been found in an FCC flue gas line during a unit shutdown15.
Arsenic is naturally found in crude oil. The arsenic compounds in FCC feedstock primarily react to arsine (AsH3); additionally, some arsenic leaves the unit in the liquid products. Arsenic is highly reactive towards nickel and noble metals, and arsenic compounds have a negative effect on the catalysts of downstream units for reactions such as polymerization, reforming, and hydrotreating16. Guard beds are often used to remove the arsenic-containing compounds and protect catalyst in downstream units. Arsenic in FCC feedstock has not been found to deactivate the cracking catalyst, probably because arsenic is not reactive towards the silica-alumina structure of the zeolite. Levels that Grace has seen for arsenic on e-cat are typically below 20 ppmw. An important consideration in measuring arsenic in e-cat and fines is the analysis method. Inductively coupled plasma atomic emission spectroscopy (ICP-AES) is not suitable for determining arsenic levels in e-cat since the lanthanum in the e-cat will interfere with the arsenic line such that incorrect high levels of arsenic will be reported. Difficulties with ICP-AES analysis – for samples with both arsenic and lanthanum – have been observed in other industries17. Preferred techniques for determining arsenic on e-cat and fines are inductively coupled plasma mass spectroscopy (ICP-MS) and neutron activation analysis (NAA). Potential interferences also exist in these two methods, and any lab doing analysis should be informed of the presence of lanthanum. The topic of arsenic in FCC is covered further in the answers to Question 4 from the 2016 APFM Cat Cracker Q&A.
BRYAN DINKEL [Marathon Petroleum Corporation (MPC)]
We have seen trace amounts of barium at one of our units, but the levels were low enough that there was no impact. Barium has been linked back to tight oils in literature discussion and in follow-up conversations with the catalyst supplier on this particular unit.
ALEXIS SHACKLEFORD (BASF Corporation)
Other contaminants that are seen include calcium (Ca), barium (Ba), potassium (K), phosphorus (P), mercury (Hg), arsenic (As), magnesium (Mg), and lead (Pb). The elements that are alkali metals or alkaline earth metals – Ca (calcium), Mg, and K (potassium) – will all act similarly to sodium, in terms of neutralizing acid cracking sites, if they come in contact with the feed. Ca and Mg can also be present in vanadium traps, although these chemicals do not cause adverse catalytic effects. Currently, Ca is showing up in greater quantities than before with new opportunity feeds. Mitigation strategies include improved desalting and increased catalyst addition rates to make up for the loss in activity or the use of flush catalyst. These metals, especially Ca, may plug catalyst pores, so be sure to use a catalyst with proper pore architecture. Barium can come in with some tight oil feeds and can be present in some vanadium traps. Barium shows no impact on activity if the catalyst contains rare-earth. Arsenic is still uncommon; but occasionally, it is seen and volatile under FCC conditions. It does not affect yields and leaves with the C3= stream where it will need to be removed as small quantities will poison petrochemical catalysts (more than 20 ppb). Phosphorus is found in ZSM-5 additives and some catalysts. If coming from the feed (found more prevalently in tight oil feeds), it can leave with the products or deposit on the catalyst; however, there are no adverse yield impacts. Lead is still uncommon but will poison CO promoters if they are present. Mercury is also still uncommon and will leave with the products, often in the heavy naphtha stream. If sent to a reforming unit, a few ppb of mercury will poison the precious metals catalyst and needs to be removed.