Question 55: Given the expansion of the Industrial Internet of Things (IIoT), “Big Data”, cloud-based technologies, and advanced analytics, how are you applying these cutting-edge aspects into their work processes and toolkit to optimize FCC yield, reliability, and safety performance?
BHARGAVA (KBC Advanced Technologies, Inc.)
Some of the biggest challenges we have seen with “Big Data” revolve around security. Within the KBC software suite, we focus on security as our major differentiator. Given the connectors we have in The Cloud, we can now download the data from the refinery in a secure fashion and put it into one location; so, when people retrieve the data, they are all looking at one consistent set. That way, Yield Accounting is not looking at different numbers for closures from their perspective alone. The process engineer has his/her own mass balance that creates a lot of issues around the refinery.
The other big issue here is accessibility of the data: who inputs the data and who has the access to change it. All those issues must be addressed before you start using The Cloud to improve your data that is already on The Cloud. Because we are able to use this data and have access to lots of capacity, we are now able to micromanage, if you please, in terms of identifying and doing performance audits. We are even using this approach for shift performance information to see how one shift is doing against another. We can now get most of the information from The Cloud because we are able to store more data. This easy access to information has allowed simulation to move to a different level. We have been able to use the gobs of data we have from the DCS (distributed control system) to develop models that are more accurate. We can calibrate these models. In fact, in some of the real-time applications we have used, we have been able to calibrate the models on the hour. These models also allow us to set operational targets more accurately. That is about as far as we have gone with “Big Data”. So, it is all about finding your best possible operation and what you have done across the shift on a 24-hour average.
The benefits of having more data, sifting through it, and identifying good stable operation data to develop simulation models are all being used to generate LP (linear program) vectors, which are then used by the planners to help with crude selection and then do a gross optimization. From a yield perspective, it has definitely helped a lot. From a safety reliability standpoint, we now have enhanced unit monitoring. The old method of unit monitoring was to gather a number of KPIs (key performance indicators), have an operating range, and then try to optimize the unit in the operating envelope. We have used simulation as a way to help with some calculated variables that affected reliability of the unit. We have expanded the windows from operating envelopes to an integrity operating window to allow people to have a much better idea of or prediction capabilities on equipment failure.
Finally, having this data on The Cloud has allowed the SMEs (subject matter experts) from within the corporate level of the company to look at the same data set and help with the optimization of the unit from a remote location. You can also do this with third-party consulting companies to allow for another perspective with a fresh set of eyes to help make sure that the unit is running optimally on a daily basis.
SANJAY BHARGAVA (KBC Advanced Technologies)
With the advent of “Big Data” and cloud-based technologies, refiners are now able to harvest mega data in a process environment. Hundreds of thousands of values are being generated every few seconds to measure, monitor, control, and optimize plant operations. The major benefit of “Big Data” is to demystify the different plant data used by various parts of the organization by using with a common set of information that is utilized by all departments. In the modern refinery, the key is transparency in strategy, philosophy, and shared goals. The benefits are seen in reliability, safety, and operator consistency.
Also, refiners using in-house or third-party simulation technologies are able to extract precise information from these “lakes” of data about the performance and compare it to the best possible performance of the plant. Some companies are already tapping into this pool of information – through the use of simulations – to provide a robust means for selecting a set point or target setting of the independent variables.
The data is also being used in open-loop controls (and limited closed-loop controls) to help make advanced decisions to improve plant performance. The simulation models are being calibrated and updated to maintain prediction fidelity. The calibrated models are being used to generate LP vectors to keep the refiner’s planning models updated in order to mimic actual plant operation which will optimize feed and operating conditions, such as riser outlet temperature, feed preheat temperature, and main fractionator cutpoints in FCCs.
Advanced or enhanced unit monitoring applications are being used by refiners to convert raw data into key performance indicators. These applications are being linked to simulation technologies in real-time to generate calculated/derived key performance indicators focused on ensuring operation within integrity operating windows (IOWs) to help improve the plant reliability and safety and to maximize plant life by monitoring for corrosion, erosion, fouling, and accelerated mechanical equipment damage in order to allow for early action and prevention which will improve reliability and safety performance. These enhanced applications are also being used for predictive maintenance, as well as for monitoring the performance of operators between operating shifts and bringing shift performance closer to best possible operations, which will benefit all shift teams. These advanced unit monitoring applications, in addition to the cloud-based technologies with added security, are now being used by managers to view plant performance dashboards on their mobile devices. Finally, the data can also be used to perform remote monitoring by subject matter specialists – both within and outside of the organization – to optimize FCC operations. This monitoring can be now done due to enhanced security systems put into place to protect refinery data.
KATHERINE JONES (Honeywell UOP)
Honeywell recognizes the untapped potential of the industrial internet of things (IIoT) and sees these capabilities as the next revolution in industry:
-
IIoT enables users to leverage all data available including stranded data that, until now, has not readily used in business decisions.
-
Cloud-based solutions allows for a more collaborative environment to enable users to benefit from global expertise.
-
The use of big data and analytics, combined with the computing power of the Cloud, enables the investigation of large data sources and the discovery of new insights.
Maintaining high onstream efficiency and reliability are critical parameters for maximizing plant profitability. To help our customers maximize the use of their assets, Honeywell UOP offers a suite of cloud-based services with the Honeywell Connected Plant. One of these services, Process Reliability Advisor, combines plant data with UOP Process models that are tuned to current operation, plus a fault model which are cause-and-effect relationships and troubleshooting guides specific for the process. The service utilizes a cloud-based platform that supports big data analytics and machine learning to drive continual innovation.
Process Reliability Advisor enables our customer to:
-
Detect performance gaps early and perform mitigation steps,
-
Understand the unit’s current performance and asset utilization based on constraints, and
-
Promote learning and knowledge retention, leveraging UOP insights and context.
More information can be found at www.uop.com/cps including videos on how Process Reliability Advisor works.
Year
2017
Process
Question 59: What challenges have you faced from processing crudes that contain elevated levels of wax crystal modifiers or flow improver chemicals?
DION (GE Water & Process Technologies)
This is a complex question. There are many different chemical families that can be employed as either wax crystal modifiers or flow improvers. Flow improvers can be dragging reducers or pour point depressants. I recommend empirically measuring its impact. For instance, if the concern is the additives’ impact on desalter operations, then the additive can be easily tested in a laboratory desalter simulator. The emulsification tendency of the crude can be measured with and without the additive. All specialty chemical suppliers should have desalter simulators, most of which are portable. The testing can be conducted in the refinery’s laboratory, if desired.
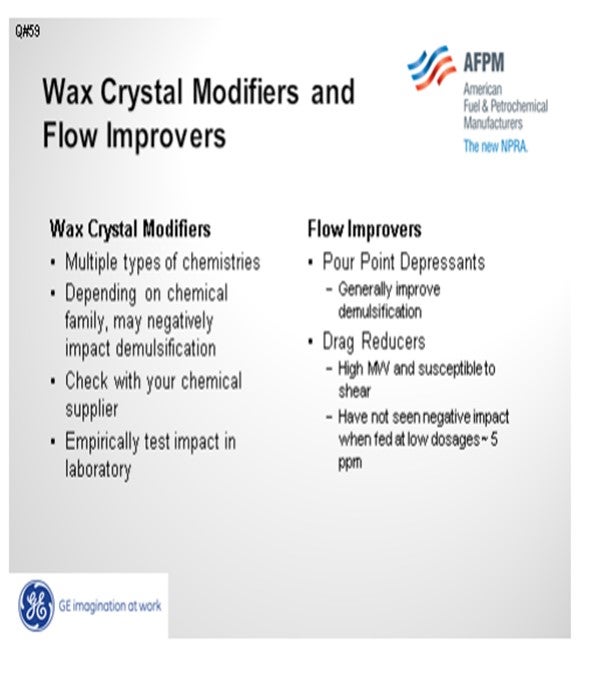
In general, the most common types of pour point depressants will be complementary or synergistic to demulsification. There are too many different chemical families that can be employed to make a general statement about whether wax crystal modifiers are synergistic or antagonistic to demulsification. It can be empirically determined. Drag reducers are very high molecular weight molecules. They are sensitive to shear and break into smaller molecules when they pass through pumps. The larger molecules that are not sheared should act similar to an asphaltene. In one refinery, we saw a situation where a drag reducer was overfed. The excess drag reducer precipitated in their raw crude tanks. When the tank was opened for corrosion inspection, they found a five- or six-inch thick deposit of an elastic, sticky material that had to be cut with shovels to get it out of the tank.
DION (GE Water & Process Technologies)
Wax crystal modifiers are typically amine oxides, amides or sulfonates. They are utilized to keep paraffins dispersed and reduce wax deposition. Flow improvers generally fall into two categories; pour point depressants and drag reducers. They are typically stearates, vinyl acetate copolymers, polyacrylates or polymeric alpha olefins. Pour point depressants typically promote the formation of compact, three dimensional crystals as the crude oil cools. The compact crystals decrease the pour point of the oil and improve low temperature flow properties. Flow improver chemicals are typically extremely large molecular weight materials. Like asphaltenes, they can precipitate to an oil/water interface and stabilize emulsions. There have been no noticeable desalter performance issues at dose rates of approximately 5 ppm. When dose rates are roughly 15 ppm to 25 ppm, desalter upsets may occur. In at least one refinery, a six inch layer of sticky elastic, caulk-like material has been observed on the bottom of the tanks and believed to be due to flow improver chemicals. In general, pour point depressants can improve emulsion resolution, while on the other hand paraffin inhibitors may have a deleterious effect. The exact effect would require either more specific information on the chemistry or empirical testing results.
BASHAM (Marathon Petroleum Corporation)
We have run crudes with flow improver at Marathon Petroleum Company’s Catlettsburg refinery for four to five years now with no known issues on our crude units.
DENNIS HAYNES (Nalco Energy Services)
In the past, there were some types of these chemistries in oil production that were reported to have problems on oil-water separation in desalting at the refinery; however, in recent history, improvements seem to have been made, and the products we have been asked to review for other companies have not shown adverse impacts regarding emulsification. If there is an indication that a new product is being used, evaluation on downstream impacts is recommended.
SAM LORDO (Nalco Energy Services) There have been a few reports of impacts on the amps/volts from crudes treated with pour point depressants. The impact was minor but noticeable in that additional power-draw was observable.
Year
2012
Process
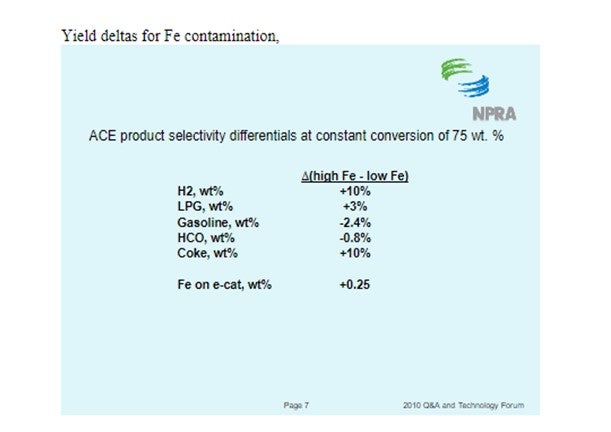
Question 101: What analytical methods can distinguish between organic and inorganic iron (Fe) compounds in the feed? What type of iron, organic or inorganic, affects catalyst performance? Considering the relatively long reaction residence time of most laboratory test units used to measure activity, will activity testing properly reflect the actual in-FCCU activity under conditions of Fe contamination? What is your best method to monitor the catalyst performance under Fe contamination? Is ther
Dwight Agnello-Dean (BP)
We have not routinely attempted to identify the organic and inorganic iron components in our feeds. An internal expert suggested two approaches. First to determine the organic iron using ICP-OES, then wash the same sample with DI water, or slightly acidified water, and utilizing atomic absorption, determine the inorganic iron. The second approach is to determine total iron utilizing X-Ray, ICP or Atomic Absorption. Following this step remove the solids and water soluble, which would contain the inorganic iron, and rerun the hydrocarbon sample to determine the organic iron. The difference between total iron and organic iron is the inorganic iron.
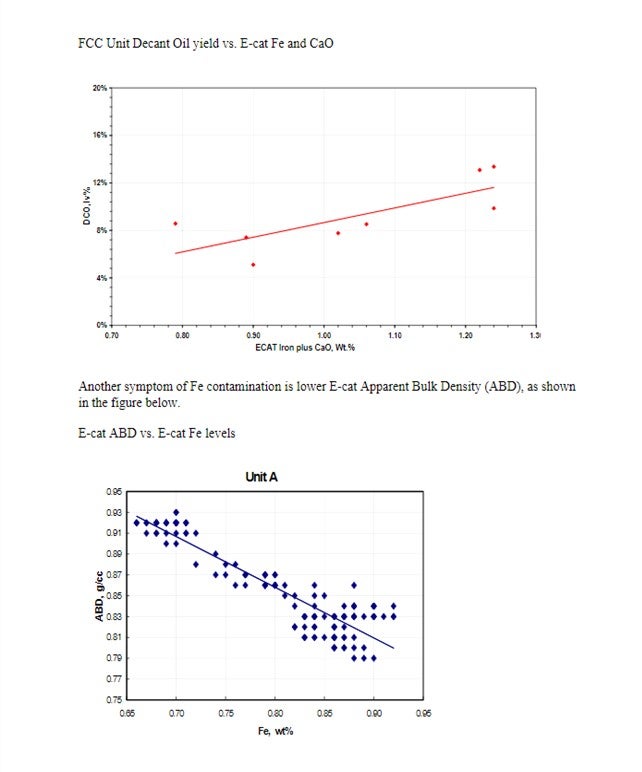
As far as which form of iron affects catalyst performance, we follow the general consensus that organic iron is the issue and of primary interest. Over the last decade we have experienced catalyst performance issues that were correlated with elevated iron on the catalyst. During these events, ecat testing did not indicate an appropriate drop-in catalyst activity, which supports the questioner’s point that ecat program test methods are not adequate for this purpose. The symptoms we do look for are loss in bottoms upgrading (higher DCO yields), a drop in catalyst bulk density (ABD), a change in fluidization properties, potential circulation issues, and of course elevated iron on ecat. Across our units we don’t have a single critical iron level where we would expect problems because we consider this to be impacted by both the catalyst and the feedstock. Therefore, our current practices are to monitor our normal iron on ecat level and begin looking for other symptoms if we see the iron increase 0.3 wt.% over normal. For the units I am most closely associated with I expect to stay below 0.8 wt% iron. These units process very clean VGO feeds.
Ray Fletcher (Intercat)
Testing methods for feed stock analyses may be found in ASTM D7691 - 11 which include standard test methods for multi-element analysis of crude oils using inductively coupled plasma atomic emission spectrometry (ICP-AES). We believe that the high-performance liquid chromatography ICP-AES may be better at distinguishing organic and inorganic metal species.
It is widely accepted that organic iron in porphyries and naphthenates negatively affect the catalytic performance more than does inorganic iron.
The primary reason for the different performance effects between organic and inorganic iron is related to the size of these molecules. It is believed that small inorganic iron species are able to penetrate into the catalyst particle in most cases and disperse easily. On the other hand, large organic iron bearing molecules are typically sterically hindered and thus are unable to penetrate within the FCC catalyst particle. These molecules tend to deposit on the particle surface forming a barrier to diffusion. These iron rich layers are often several microns thick having a very rough nodular structure.
Our R&D team has found that the ECAT surface contaminated by organic iron contains a very dense amorphous iron rich layer which seals the macro, meso and micro-pores of catalyst. There is no penetration and reaction found at the interface between the iron layer and catalyst. The outer surface of an iron poisoned catalyst particle consists of a dense amorphous aluminosilicate phase with polycrystalline magnetite (Fe3O4) nanoparticles on top.
Most laboratory deactivation and testing methodologies used today are unable to accurately predict the effect of iron poisoning in a commercial unit. FCC catalyst suppliers have been active in developing special deactivation conditions to enable more accurate prediction capability with iron poisoning. None of these deactivation procedures have yet been able to accurately model an iron contaminated unit. The one test unit which may be capable of distinguishing iron effects is the circulating pilot plant. However, due to the sample sizes involved and the time & cost commitments few refiners have been willing to carry out extensive testing with this equipment.
The best method for monitoring iron poisoning is systematic and detailed unit monitoring. The focus is on "add-on iron". Most FCC catalysts contain 0.2-0.4 wt% iron depending upon the kaolin content and source. The add-on iron is the equilibrium iron less the fresh iron. Most catalyst systems are capable of handling +0.3 wt% add-on iron before negative effects are observed. Catalysts with alumina-based binding systems are usually capable of absorbing higher levels of iron at approximately 0.4-0.5 wt%.
The actual amount of iron the equilibrium catalyst is capable of absorbing without negative impact is directly related to the concentration of all contaminant metals including: nickel, vanadium, sodium, calcium plus iron. Most catalyst systems begin to observe negative effects when the total metal levels exceed 13,000 to 15,000 ppm. There are a few FCC units which regularly defy this rule of thumb having iron levels exceeding one wt%. These units are believed to be exceptions rather than the rule.
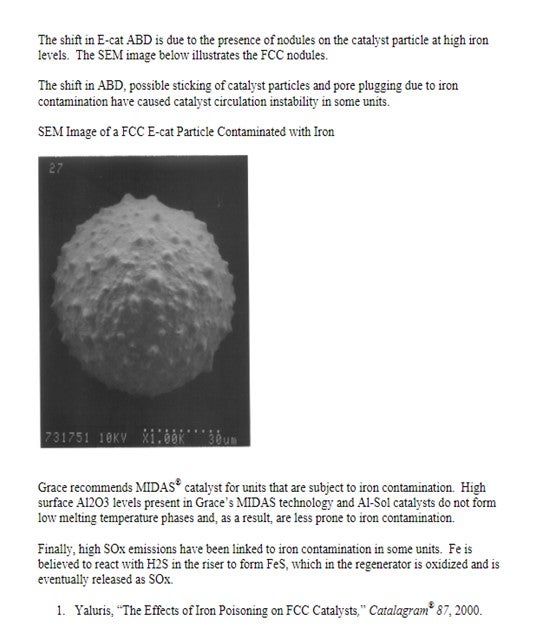
Iron nodules have been observed on the surface of equilibrium catalysts which have undergone high levels of iron contamination. The net result of these nodules has been poor blockage with a corresponding loss in bottoms conversion plus an apparent drop in ABD due to altered packing efficiencies. Many times, in spite of a lower ABD the fluidization characteristics of the unit have deteriorated. Additionally, as stated in question #99, step change increases in iron have been observed to precipitate that changes in SOx emissions. These step change increases in emissions are easily controlled by SOx reducing additive.
It is recommended that the process engineer monitor closely the levels of add-on iron and total contaminant metals. Both of these variables may be plotted against bottoms conversion or conversion. The refiner may then draw their own conclusion regarding maximum allowable iron contamination. Three methodologies exist for combating iron excursions include: 1) flush catalyst, 2) higher fresh catalyst additions &/or 3) reformulation to a more iron tolerance catalyst system.
Finally, Intercat would like to propose an alternative explanation to the underlying mechanism leading to nodule formation in iron contaminated units. It has been observed that the composition of these nodules is not solely iron but is enriched with silica. Interestingly, one would expect that beneath the iron nodules there would be silica depleted regions within the catalyst particle. However, this is not the case. The composition of the catalyst directly beneath the iron nodule has equivalent silica concentrations as those regions not affected by these nodules. This leads us to hypothesize that iron acts as a nucleating site for silica/iron nodule formation. As stated earlier, these nodules have multiple negative impacts such as reduction in conversion, reduction in ABD, and occasionally, deterioration in fluidization characteristics. (Our thanks to Dr. Diddams for sharing this hypothesis with us.)
Ann Benoit (Grace Davison Refining Technologies)
Yaluris discussed that there are two types of iron. One type is particles of inorganic iron from hardware and is usually considered benign in FCC unit performance. The second type is organic based Fe potentially coming in with the feed and/or from hardware corrosion by naphthenic acids and other corrosive feed components. This type of iron can negatively impact unit performance. (1) ACE testing is a better technique to measure the conversion impact of organic based iron contaminated catalyst, compared to traditional fixed bed MAT testing. However, ACE testing should be used together with other tests to confirm iron poisoning.
Below are several methods that can be used to monitor catalyst performance under Fe contamination:
•Ecat analysis (Fe, Na, CaO, ABD, color)
•Scanning Electron Microscope imaging (SEM)
•Optical microscope
•Ecat diffusivity
A decline in unit performance such as, reduction in bottoms conversion, and/or poor catalyst circulation coupled with an increase in equilibrium catalyst Fe levels can indicate Fe poisoning. Yaluris discussed how pore closure and nodule formation can be potentially caused by iron contamination (1). Pore closure can negatively affect bottoms conversion in the unit. An excellent way to show the actual nodules is by Scanning Electron Microscope imaging (SEM). It is important to note that some nodules may not be a problem, but there is a problem when the nodules become obviously raised from the surface and all over the catalyst particle. A drop in ABD (apparent bulk density) on Ecat can indicate nodules formation due to iron poisoning as Ecat does not pack as densely. The ABD change, pore plugging and the potential for particles to stick together can negatively impact unit catalyst circulation.
Optical microscope is another method to indicate iron poisoning. Ecat samples with iron poisoning will show glassy reflections under an optical microscope with illumination. (1) The color of Ecat could potentially indicate high levels of Fe. Ecat samples can have a reddish brown tint when poisoned by iron.(1) In addition to Ecat Fe levels, Na and CaO should be monitored as well. Fe in the presence of Na and/or CaO can act as a fluxing agent which can aggravate the effects of Fe.(1)
Year
2011
Process
Question 2: We have a Selective Hydrogeneration Units (SHU) unit that removes butadiene from the olefin feed to the alkylation unit. What is the typical concentration of hydrogen and light ends in the olefin product leaving the SHU? How do hydrogen and light ends affect alky operations?
THOMAS PORRITT (Chevron U.S.A)
A selective hydrogenation unit or SHU converts diolefins to olefins in a stream before it feeds an alkylation unit.
Below is a basic flow scheme.

Figure Q2 - 1 Selective Hydrogenation Unit Flow Scheme
The typical composition of non-condensable gases and light hydrocarbons leaving the SHU is dependent upon both the feed and the hydrogen make up. The olefin feed may contain methane, ethane and ethylene in addition to the olefins and diolefins that pass through the reactor. The hydrogen composition can contain a mixture of light hydrocarbons as well as carbon monoxide and carbon dioxide depending on the source. A component balance on these contaminants can show their concentrations in the SHU effluent for the user’s system.
Hydrogen sources vary by nature and quality. Hydrogen produced by a Steam Methane Reformer, SMR, with a pressure swing adsorption, PSA, unit will be the cleanest. PSA units can produce hydrogen that is greater than 99% pure. Not all SMR hydrogen is purified by a PSA. For SMR hydrogen that passes through methanation and chemical absorption, the hydrogen can contain methane and possibly carbon dioxide. At the other end of the spectrum is naphtha reformer hydrogen. This hydrogen can be as low as 70% hydrogen by volume. Reformer hydrogen can contain as much as 8% methane and 6% ethane by volume. The amount of carbon monoxide is dependent on the system pressure of the naphtha reformer. Low-pressure units can produce hydrogen with as much as 30 ppmv carbon monoxide. Excess hydrogen in the SHU leads to oversaturation of the olefins feeding the alkylation unit. In addition, it leads to increased reactor differential temperature and can potentially damage the palladium catalyst in the reactor beds.
The light hydrocarbons and non-condensable gases exiting the SHU pass to the alkylation unit. They then build up and lead to increased pressure in the refrigeration loop. Because they do not condense, they reduce the capacity of the refrigerant compressor and condenser. To manage pressure, the user is forced to vent the non-condensable gases at the refrigerant accumulator. Unfortunately, this venting also leads to loss of iso-butane.
To mitigate these issues the user can proactively clean up the light hydrocarbons in the FCC olefins and better purify the makeup hydrogen. In addition, the user can adjust the hydrogen to olefin ratio by improving control of hydrogen to the SHU. As a final step, the user can vent the gasses at the refrigerant accumulator.
McDermott-Lummus Technology and Dupont Clean Technologies both contributed to this answer.
BILL KOSTKA (Axens North America)
The unreacted hydrogen in the effluent of a Selective Hydrogenation Reactor is very low, typically within the range of 20-50 ppmw.
Methane in the effluent of a Selective Hydrogenation Reactor comes directly from the hydrogen make-up and thus depends on its quality. For PSA hydrogen, the typical amount of residual methane in the reactor effluent is less than 10 ppmw. For a hydrogen-rich stream containing 90 mole% hydrogen and 10 mole% methane, the methane content rises up to typically 500-1,000 ppmw in the reactor effluent.
In a Sulfuric Acid Alkylation unit, ethane and lighter may cause venting from the refrigeration receiver if levels are high. The vent would carry some isobutane, but no sulfuric acid, and would typically go to the flare. A small, packed scrubber may be needed to remove SO2 if venting is done on a continuous basis. Pentanes in the feed cause no operational problems since they will end up in the alkylate product. However, they could result in difficulty meeting RVP and octane targets if these are critical.
RICK DENNE (Norton Engineering Consultants, Inc.)
A typical design would include a downstream stripper or de-ethanizer column to remove excess hydrogen and light ends to the plant fuel gas system. The column would operate in such a manner that propylene/propane loss are minimized, so as to not downgrade their value. Ethane and lighter streams would be rejected. If fractionation is poor, the stream could be routed to the plant’s sat gas unit; however, care must be taken to avoid putting the liquid propane product off test for excessive propylene. If a stripper or de-ethanizer column is absent, the light ends will act as a diluent in the alkylation unit and the non-condensables will cause pressure issues in various parts of the unit. In this case, the owner/operator should weigh the option of minimizing hydrogen to the SHU, at the expense of more rapid catalyst deactivation, versus alkylation unit limits. Improved make-up hydrogen quality should also be considered.
Year
2019
Submitter
Process
Question 85: What is the typical range that you employ for iron content on FCC equilibrium catalyst? What methods are available to determine how iron is accumulated on the catalyst surface? How does the distribution of iron on the catalyst surface impact the FCC operation, yield structure and emissions?
Jeff Lewis (BASF)
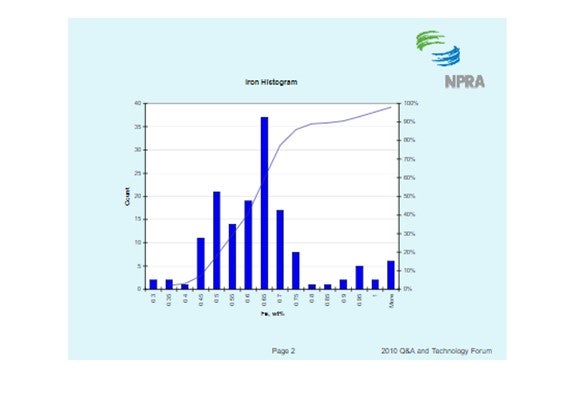
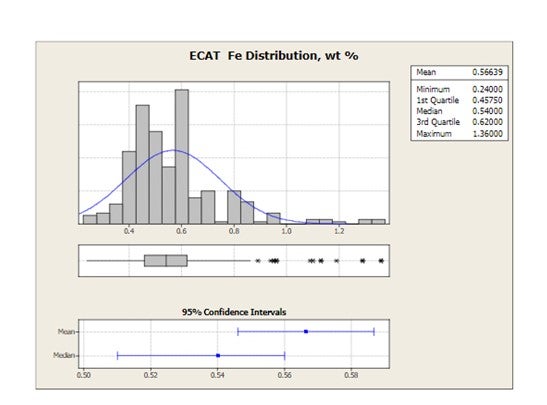
The histogram below shows the distribution of iron content for all ecat samples BASF receives. It should be noted that fresh catalyst has an iron content of about 0.55 wt%. The histogram shows that the median ecat iron concentration is approximately 0.62 wt%. This suggests the median contaminant iron level on ecat is 0.07 wt%.
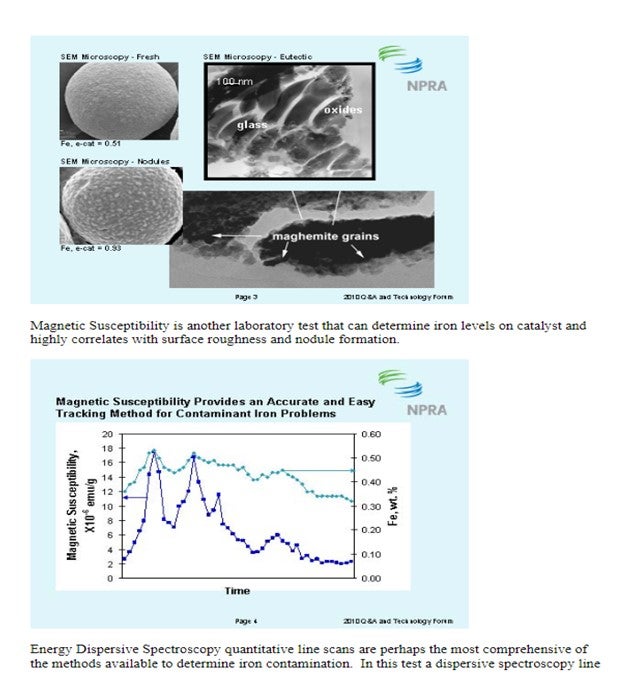
There are several methods available to quantify iron contamination on catalyst. Scanning Electron Microscopy (SEM) pictures are a valuable means to qualitatively assess iron laydown morphology on the catalyst particle. The three images below show varying degrees of iron contamination on a catalyst particle. The first picture shows a fresh catalyst particle that is free of contaminant iron on its surface. The second picture shows a catalyst particle with a significant concentration of iron nodulation on the catalyst surface. The third picture shows a low boiling eutectic formed in the presence of an alkali metal like Ca or Na and is the severest form of iron poisoning.
David Hunt (Grace Davison)
Grace receives E-cat samples for most of the FCC units operating worldwide. The figure below shows the distribution of average equilibrium catalyst Fe levels for 2010 for all FCC units that have provided E-cat samples to Grace. Mean Fe levels are 0.57 wt% and the highest Fe level in one unit is 1.36 wt%.
Iron can be detrimental to the unit in many ways including bottoms conversion, catalyst circulation stability and SOx emissions.
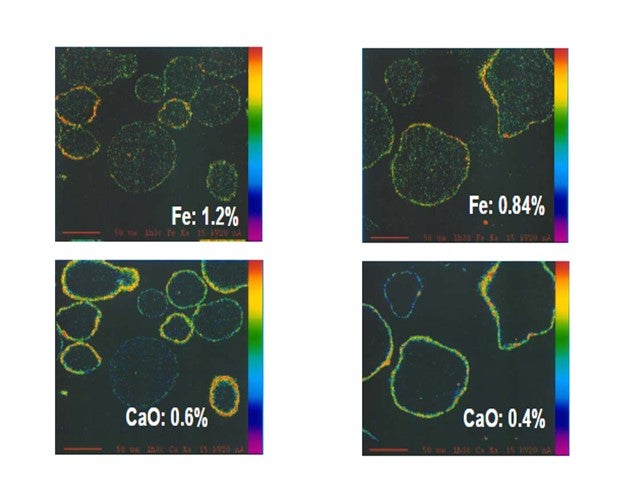
Yaluris (1) showed using an Electron Probe Micro-Analysis (EMPA) technique that iron from organic iron sources is primarily a catalyst surface contaminant. Yaluris also used scanning electron microscopy and optical microscopy techniques to confirm Fe is a surface contaminant. The figure below is an EMPA image of an FCC catalyst particle cross section. Warmer colors on the surface of the particle confirm that Fe and CaO are primarily surface contaminants. EMPA Image of Two FCC Catalyst Particles
Yaluris (1) discussed how Fe contamination can lead to pore closure and nodule formation. The presence of Na and CaO can act as fluxing agents, aggravating the effect of Fe. The figure below shows Decant Oil or Main Fractionator bottoms yield vs. E-cat Fe plus CaO levels. Decant Oil increases at the higher contaminant levels due to the damaged catalyst pore structure.
Year
2010
Process
Question 13: Severe fouling of diesel and gas oil hydrotreating preheat exchangers has been a growing problem. In your experience, what are the causes and how can these be prevented? Have you tried antifoulant injection in this service?
Dan Webb (Western Refining)
Fouling of the heat exchanger train is sometimes a problem particularly when processing cracked feed stocks. The fouling is often caused by polymer like compounds (gums) that form when petroleum distillates come in contact with air. When heated olefinic compounds react with absorbed oxygen to form gums that deposit in the preheat train.Iron scale and other particulates in the feed often adhere to these gums to produce severe fouling that restricts unit capacity and accelerates heat exchanger corrosion rates. Typically, every effort is made to avoid air ingress into any of the unit feed stocks. Fouling precursors may also be present in straight run feed stocks in the form of certain chemical contaminants that may be present in the crude or inadvertently introduced in an upstream process unit. Some precursors such as amines, carboxylic acids, and carbonyls form gums without air ingress into the feed. Antifoulants have been used successfully to mitigate fouling caused by these compounds in addition to mitigated fouling caused by oxygen contaminate cracked feed stocks.
Michael Chuba (Sunoco)
Typically distillate hydrotreaters exchanger fouling has been associated with cracked stocks that contain olefinic material and trace amounts of O2 coming in with the feed from tankage. In addition to oxygen-initiated polymerization, other impurities can lead to free radical formations that can promote polymerization reactions. These impurities include certain nitrogen and sulfur compounds well as some metal ions including iron, calcium, and magnesium.
In addition to free radial polymerization, condensation polymerization reactions can also result in fouling. In this route, two radicals can react to form a larger molecule. The new compound can continue to react and grow until it precipitates out of solution forming deposits.
What I would like to present here is an example of fouling we had on one of our units and how we have significantly reduce fouling via a simple jump over line.
Prior to conversion of this unit to ULSD the unit processed a mix of virgin and cracked distillate stocks. Historically this unit had exchanger fouling that was attributed to the presence of the cracked stocks. When the unit was converted to ULSD the cracked stocks were removed. The resulting feed was a 50:50 mix of direct rundown material from the crude unit and tankage. As a result of this change in operation it was anticipated that the fouling rate would decrease, however, during actual operation the fouling rate actually increased.
An initial program to address the problem included detailed analysis of the various feed stream followed by a targeted antifoulant chemical injection program. Results were somewhat effective but still left significant room for improvement. Continued investigation into the problem targeted O2 contamination coming from the material coming from tankage. The intermediate distillate tanks are cone roof design which would be relatively costly to convert to blanketed tanks. As a first step it was decided to install a jump over from the tank inlet line directly to the suction of the tanks’ transfer pumps. With this simple connection the average volume of material actually drawn from the tanks dropped dramatically.
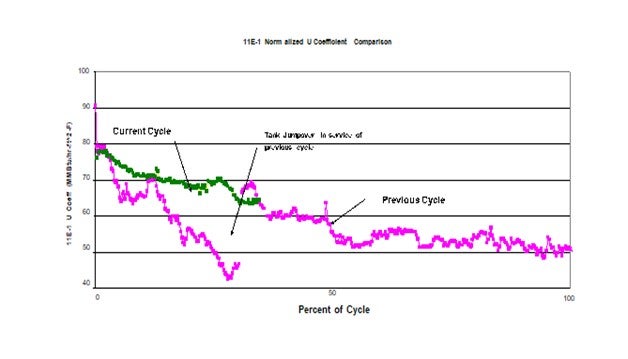
This plot shows the impact on the heat transfer coefficient of the feed effluent exchanger as a result of this simple jump-over. The pink plot represents the previous cycle. At about ¼ of the cycle the jumpover line was installed. At this point significant fouling had already occurred. The discontinuity in heat transfer coefficient a week or two later was the result of a power failure. It is suspected that the rapid depressurization dislodges some of the fouling material thereby improving the heat transfer when the unit is re-streamed. This same response has been seen in previous emergency shutdowns. The green plot represents the current cycle which started with a clean set of exchangers and operation of the jumpover in service from day 1 of the cycle. As can be seen this simple jumpover has significantly reduced the rate of fouling compared to previous cycles. Since the only change was the potential ingress of O2 from the tank, this project confirmed the impact O2 had fouling.
Gregg McAteer (Nalco Company)
Fouling can be a serious problem in hydro-desulfurization (HDS) units because of their importance in producing fuels that should meet environmental specifications. Fouling can limit a unit's ability to maintain a specific feed rate or meet an extended turnaround date. It can greatly influence product quality as well as energy consumption, and catalyst or equipment life. Stricter limits on sulfur and aromatic content of finished fuels make fouling control even more important today. To achieve today’s limits of 0.05 wt.% for diesel, refiners must increase severity of refining operations, which often worsen fouling. Fouling ultimately necessitates shutdown and extensive maintenance, a costly process, both in terms of maintenance expenditures and lost production. Causes of fouling in diesel and gas oil hydrotreaters are both organic and inorganic in nature. The organic foulants are primarily gums formed as a result of processing cracked material and accelerated if the material is exposed to oxygen at any time. Antioxidants and/or antipolymerants are used to reduce the formation of gums and dispersants are used to keep any gums already formed from growing in size.
In one case an antifoulant program utilizing both an antioxidant and a dispersant was applied to a gas oil hydrotreater that normally fouled enough to require a shut down after an average of 440 days. The antifoulant program started on a fouled system and showed
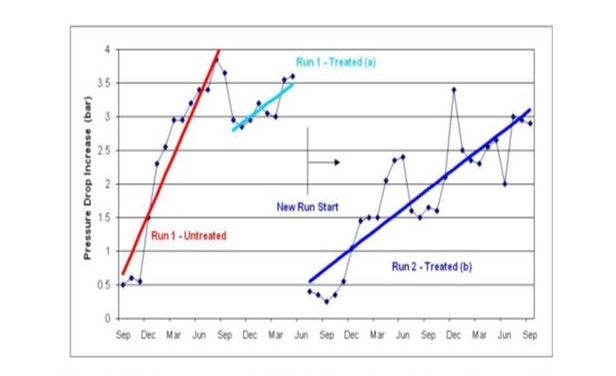
a slight recovery of pressure drop. After a shutdown they started again and achieved a 1300 day run (see graphic below).
“Run 1” is shown in red and light blue. The red trend shows the steep increase in pressure drop during normal operation (without antifoulant program). The light blue trend shows the antifoulant program started, saw a small decrease in pressure drop, and then the unit was brought down for a regeneration. “Run 2” is shown as the dark blue trend and shows a lower fouling rate and longer run length with the antifoulant program. Customer estimated the ROI to be between 400-500%.
Phil Thornthwaite (Nalco Company)
Foulants typically found on the feed side of the preheat exchangers include various gums or polymers, iron sulphide and salts.
The organic fouling due to gums & polymers results from the polymerization of unstable species in the unit feed. The problematic species include olefins (generated in cracking processes), organic acids, mercaptans, ketones, aldehydes, phenols, organo-nitrogen and organo-sulphur compounds. Therefore, in order to determine the risk of organic fouling for a particular feed stream, detailed analysis for the problematic species can be useful guide in evaluating fouling propensity and mitigation strategies.
A typical level for concern for each problematic specie is outlined below:
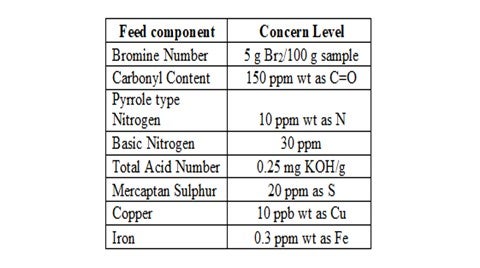
Another key factor to consider is the oxygen content of the feed stream as this can promote the polymerization of various unstable compounds, particularly olefins. Therefore, it is good practice to exclude oxygen from feed storage tanks by ensuring tank seals and vents are in good condition and through the use of a nitrogen blanket. However, this method is ineffective with streams already exposed to oxygen since the nitrogen blanket will have no effect on oxygen reaction products such as aldehydes, peroxides and hydroperoxides.
Inorganic fouling is mainly caused as a result of iron sulphide that can either be carried from upstream units or generated in-situ in the preheat exchanger network. However, the latter is not so common since refiners choose the metallurgy to mitigate against sulphidic corrosion in most cases.
In order to mitigate and control fouling in the preheat train, chemical dispersants and antipolymerants are used. The properly selected dispersant will act upon the organic polymers by keeping them finely dispersed within the feed stream thus minimizing the risk of deposition on the exchanger surfaces. Likewise, dispersants can also prevent deposition of FeS by keeping them dispersed in the feed stream.
Antipolymerants act by disrupting the propagation and chain extending stages of the free radical polymerization reactions and by increasing the rate of termination. This will limit the rate of polymer growth within the preheat system. They will also minimize carbonyl formation which will in turn disrupt condensation polymerization reactions.
The key to monitoring the program effectiveness is through accurate monitoring of the preheat exchanger network. If the fouling results in a limitation of heat transfer efficiency, then a temperature survey of the exchanger network is carried out and this data is entered into a rigorous thermodynamic process model, such as Nalco’s MONITOR® program. This model will then use the plant data to calculate actual and normalized exchanger duties and heat transfer coefficients plus it will calculate the normalized furnace inlet temperature (NFIT). A successful antifoulant program will limit the decay in the NFIT and will generate significant returns for the refiner by improved energy efficiencies and optimized unit operation.
Robert Wade (ART)
We have not had success reducing fouling effects by adding antifoulants. It is our experience that adding antifoulants at best treats the symptom of the problem, and at worst further contributes to localized and downstream fouling. We recommend that the source of the fouling contaminant be identified through analysis and addressed at the source. If this is not possible then we revisit the basic design of the heat exchanger in question and ensure that it is operating in a shear controlled flow regime so that fouling effects are minimized
Year
2010
Process
Question 41: Have the panel members considered 15% ethanol (E15) gasoline blending?
KOONTZ (HollyFrontier)
My first slide shows a little background. The EPA administers the Renewable Fuel Standard program that has volume requirements for renewable fuels. They established these volume requirements under the Energy Independence and Security Act of 2007. The EPA tracks compliance with the Renewable Identification Number (RIN) system, and they assigned a RIN to each gallon of renewable fuel.

HollyFrontier satisfies much of its requirement for conventional biofuel, which is essentially corn ethanol, by blending E10 gasoline at many of its terminals. Most of HollyFrontier’s gasoline is sold via pipeline to terminals owned by others; therefore, we are not able to supply our full mandated volume. HollyFrontier does purchase RINs from others. The decision to purchase ethanol to blend or the RINs is based on the economics of the cost of the RINs.

Ethanol blending for the refiner does have a significant impact on two critical gasoline properties: namely, octane and RVP. The hydrocarbon blend stock used for 90% of the E10product, which HollyFrontier calls sub-grade, has an octane rating of about 84. After blending with the 10% ethanol, the resulting octane is the regular 87. So being a refinery that adjusts total octane with its reformer severity, this allows us to run a lower severity, which is especially beneficial to those refineries with semi-regen reformers that operate at relatively high pressures and relatively low liquid volume product yield.

RVP is the other critical property affected by blending. When ethanol is blended with naphtha at a low concentration, the RVP of the gasoline is increased. Pure ethanol does have a low RVP; but when it is blended with hydrocarbon, it behaves more like a light hydrocarbon and actually raises the RVP. For example, with E10 for naphtha having an RVP of 9, the resultantE10 product has an RVP of about 10. So, to encourage ethanol blending, in 1990, the U.S. Congress passed a waiver known as the “One-Pound Waiver” which allows E10 gasoline to be sold at one psi (pound per square inch) higher than that normally required.
For the refinery, E15 would allow lower octane severity reformer operation, which would be beneficial. However, the EPA regulation implementing the “One-Pound Waiver” specifically references gasoline containing between 9% and 10% ethanol. The EPA has refused to extend this One Pounder Waiver to E15. Therefore, marketing E15 requires a sub-grade blendstock that has an RVP approximately 1 psi lower than normal gasoline sub-grade blendstock used for E10.

In addition, since January 2011, E15 has been permitted for use in light-duty motor vehicles manufactured after 2001. It was not approved to be used in small gasoline engines or other vehicles built before that due to concerns of material incompatibilities and corrosion. Furthermore, I have seen several places where current automobile manufacturers will not honor their warranties if the person used E15, even if the vehicle was manufactured after 2001. Also, the EPA requires that in order to sell E15 gasoline, a Misfuelling Mitigation Plan must be in place to prevent consumers from using the product in an unapproved engine. Today, there are very few retailers who have chosen to go through the additional trouble in order to sell the E15.
In conclusion, due to the absence of the “One-Pound Waiver” and the legal risk of corrosion or voiding the warranties of customers’ cars, HollyFrontier has chosen not to produce or blend E15.
SUBHASH SINGHAL (Kuwait National Petroleum Company)
Does the 15% have to do with the oxygen in the ethanol and other oxygenate like MTBE, or it is just because of the RVP limitations and other issues that you explained? From safety point of view, is there oxygen contained in the old oxygenate like ethanol? Is that one of the criteria for limiting the blending from 15% or 10%? Does this have to do with the oxygen
attached even though it is oxygenate?
KOONTZ (HollyFrontier)
My understanding, from reading, is that the E15 decision is not really based on logic. I think it was more of a U.S. Congress action. I do not really understand why they have not extended the “One-Pound Waiver” to E15. I do not think it is based on science.
KOONTZ (HollyFrontier Corporation)
The Environmental Protection Agency (EPA) administers the Renewable Fuel Standard (RFS) program with volume requirements for several categories of renewable fuels. EPA establishes the volume requirements for each category based on EISA (Energy Independence and Security Act of 2007) legislated volumes and fuel availability. EPA tracks compliance through the Renewable Identification Number (RIN) system, which assigns a RIN to each gallon of renewable fuel.
HollyFrontier satisfies much of its requirement for Conventional Biofuel (essentially corn ethanol) usage within RFS by selling E10 (10% ethanol) at many of its terminals. Most of HFs’ gasoline is sold via pipeline to terminals owned by others; therefore, to fully satisfy its mandated volume, HF purchases RINs from others. The decision to purchase ethanol from others and blend to E10 or to purchase RINs from others is based on economics.
Ethanol blending has a significant impact on two critical gasoline properties controlled by the refiner: octane and RVP. The hydrocarbon blendstock used for 90% of the E10 product (termed sub-grade by HF) has an octane rating of ~84. After blending with 10% ethanol (octane ~114) the resultant E10 octane is “regular” 87. For a refinery that normally adjusts reformer severity to satisfy the total gasoline pool octane, producing sub-grade allows for lower reformer severity and higher liquid yield. This improved yield is more pronounced for a semi-regeneration reformer that operates at relatively high pressure.
RVP is the other critical gasoline property affected by ethanol blending. When ethanol is blended with naphtha at low concentration, the RVP of the gasoline is increased. Even though pure ethanol has a low RVP [about 2 psia (pounds per square inch absolute)] due to O-H bonding, it behaves more like a hydrocarbon with a molecular weight of 46 when mixed with naphtha at low concentration. If ethanol is blended to 10% with 84 octane naphtha having an RVP of 9, the resultant E10 gasoline has an RVP of ~10. In order to encourage ethanol blending, the U.S. Congress passed the One-Pound Waiver in 1990 allowing E10 gasoline RVP to be 1 psi higher than that normally required by the EPA (One-Pound Waiver).
E15 would allow a refiner to produce an even lower octane sub-grade to blend with the ethanol and the RVP effect would be similar. However, the EPA regulation implementing the One-Pound Waiver specifically references gasoline containing between 9% and 10% ethanol. The EPA has refused to extend the one-pound waiver to E15. Therefore, to market E15 requires a sub-grade blendstock having an RVP over 1 psi lower than that required for E10.
Since January 2011, E15 has been permitted for use in light-duty motor vehicles manufactured after 2001. However, it is not approved for use in small engines and older vehicles due to concerns with material incompatibilities and corrosion. Furthermore, several automobile manufacturers will not honor their warranties if E15 gasoline was used in the vehicle (even for those manufactured after 2001). The EPA requires that in order to sell E15 gasoline, a Misfueling Mitigation Plan must be in place to prevent consumers from using the product in an unapproved engine. There are very few retailers who have chosen to get approval to sell E15.
Due to the absence of the One-Pound Waiver for RVP, the significant legal risk in selling a controversial product, and the minimal market demand HF has decided that it would be unwise to enter the E15 market at this time.
Year
2012
Process
Question 91: What are the characteristics of FCC catalyst to minimize particulate emissions at the stack?
John Aikman (Grace Catalysts Technologies)
While there are several operational and mechanical factors that can influence a unit’s particulate emissions, the question asks specifically about the FCC catalyst; as such, the following discussion will address characteristics of fresh catalyst only.
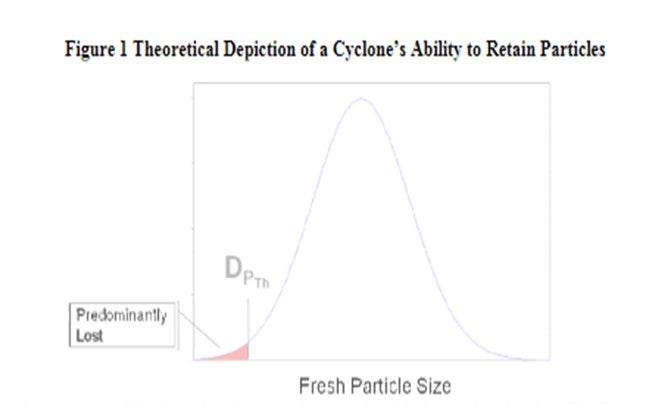
There are four basic characteristics of FCC catalyst that can have direct effects on particulate emissions. These same characteristics will also affect particulate losses to the fractionator and slurry product. The first characteristic is simply the amount of fines content coming into the unit with the fresh catalyst due to the manufacturing process. Figure 1 is an example of a typical fresh catalyst particle size distribution, with a theoretical depiction of a cyclone’s ability to retain fresh catalyst particles. DPTh is the smallest particle diameter which can reliably be collected by a cyclone and is used to model cyclone performance. Particles below this size will be lost by the cyclone.
A review of the Grace Ecat database showed that none of the FCCU’s in North America can retain any 0-20 μ range particles. In addition, they only retain an average of approximately 4.0 wt% in the 0-40 μrange. Fresh catalyst typically ranges anywhere from 9 to 16% of 0-40 μ depending on the supplier andmanufacturing process. Some units require higher amounts of 0-40 μ range particles to help with circulation.
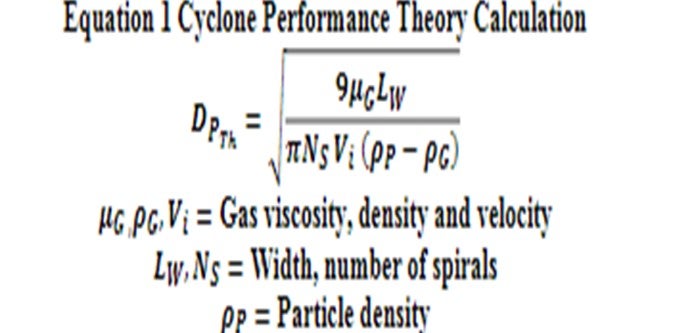
The next characteristic of fresh catalyst that must be considered is the particle density. he DPTh mentioned above will decrease with increased catalyst particle density, per Equation 1 below. This means that cyclones can retain smaller particle sizes as the particle density increases. This is due to the centrifugal force acting on a heavier particle. However, particle density is not the same as apparent bulk density (ABD). Industry typically measures and reports ABD as part of the routine Ecat analysis, but this should not be mistaken for particle density for cyclone efficiency purposes. Since Al2O3 is denser than SiO2, catalysts with higher alumina content will have higher catalyst particle density.
The third characteristic is the inherent attrition resistance of the fresh catalyst. Industry measures the attrition resistance via a variety of tests, with the primary goal of providing a relative indication of catalyst attrition resistance. Grace utilizes the DI test or Davison Index. On the DI scale, a lower number is less likely to cause attrition and generate microfines. It is usually not valid to compare attrition resistance results obtained from different laboratories. Additionally, it is important to note that the energy applied to a catalyst sample during attrition testing is much more severe than commercial conditions.
As discussed above, the majority of the microfines created in the FCCU will leave the unit through either the reactor or regenerator cyclones, with the latter potentially contributing to increased particulate emissions at the stack.
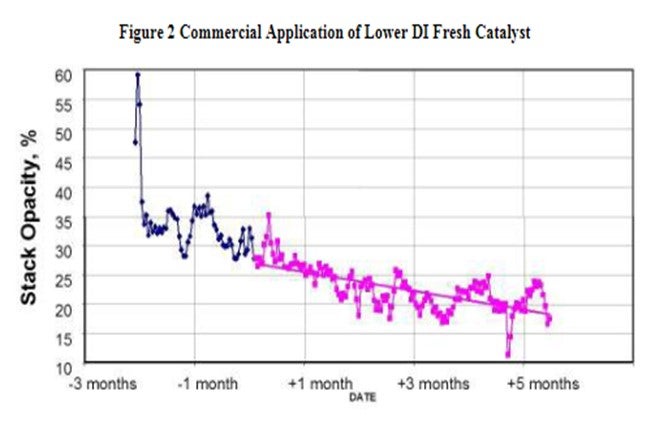
'The attrition resistance of the catalyst is a function of the manufacturing process and the binder material utilized during the manufacturing process. Figure 2 is an example of how a refiner improved the FCCU stack opacity with catalyst formulation. The reduction was achieved changing to a Grace supplied catalyst with lower DI and lower 0-40 μ content in the fresh catalyst.
The final characteristic of fresh catalyst that affects particulate emissions is its morphology. Morphology can be defined as the study of the form and structure of a particle and its specific structural features. A catalyst particle that has a smoother exterior surface is less likely to generate microfines in an FCCU. Even catalysts with a low fresh DI measurement can cause increased particulate emissions if there are surface irregularities resulting from the manufacturing process. In order to demonstrate this visually, Figures 3 and 4 present SEM’s (scanning electron microscopy) of “bad” and “good” fresh catalyst morphology for a side-by-side comparison.
Figure 3 and 4 SEM’s of Fresh Catalyst (magnified X250)
“Bad Morphology” “Good Morphology” In conclusion, there are several characteristics of fresh catalyst that can be controlled to reduce particle losses and thereby reduce flue gas emissions. Specifically, to lower emissions the fresh FCCcatalyst should possess the following characteristics: a particle size distribution with an optimal range of 0-40 μ particles, higher catalyst particle density, lower DI, and superior morphology. Grace’s alumina-sol technology provides superior binding to the catalyst particle leading to best-in-industry attrition resistance. The versatility and performance of alumina-sol catalysts coupled with Grace’s manufacturing capability, have resulted in wide-market acceptance and as a result, Grace is the preferred FCC technology for loss sensitive units around the world.
Year
2014
Process