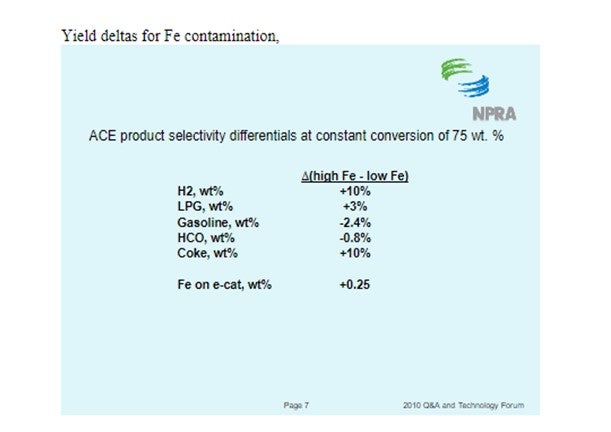
Question 85: What is the typical range that you employ for iron content on FCC equilibrium catalyst? What methods are available to determine how iron is accumulated on the catalyst surface? How does the distribution of iron on the catalyst surface impact the FCC operation, yield structure and emissions?
Jeff Lewis (BASF)
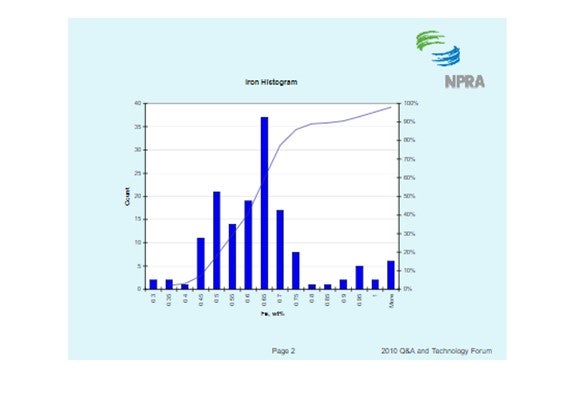
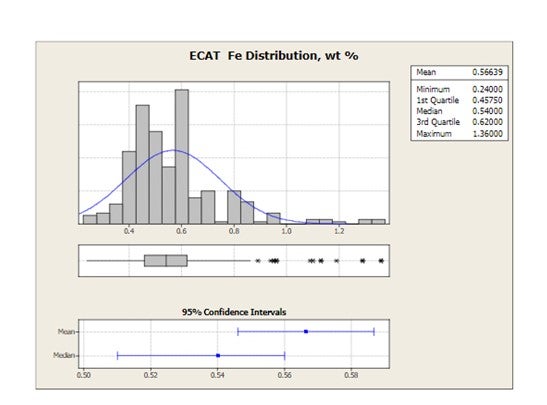
The histogram below shows the distribution of iron content for all ecat samples BASF receives. It should be noted that fresh catalyst has an iron content of about 0.55 wt%. The histogram shows that the median ecat iron concentration is approximately 0.62 wt%. This suggests the median contaminant iron level on ecat is 0.07 wt%.
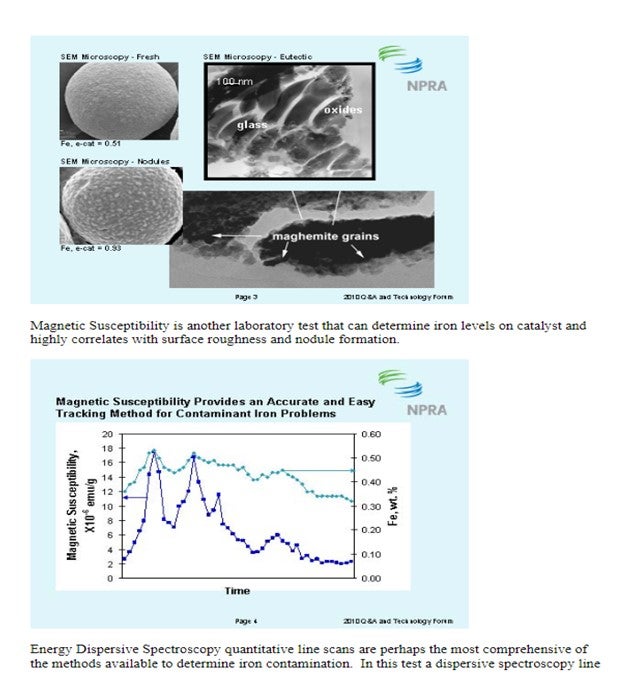
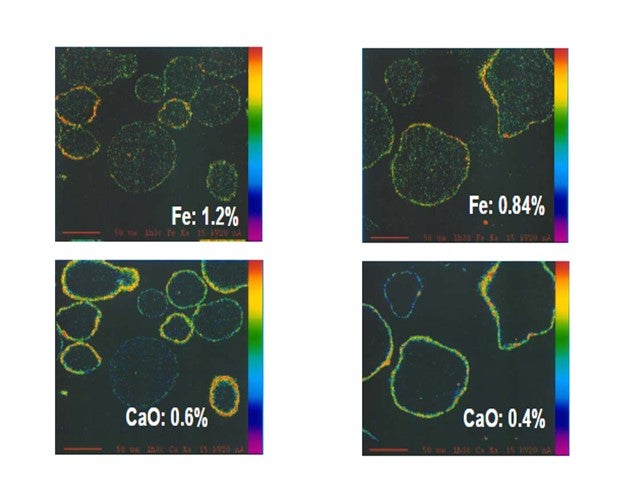
There are several methods available to quantify iron contamination on catalyst. Scanning Electron Microscopy (SEM) pictures are a valuable means to qualitatively assess iron laydown morphology on the catalyst particle. The three images below show varying degrees of iron contamination on a catalyst particle. The first picture shows a fresh catalyst particle that is free of contaminant iron on its surface. The second picture shows a catalyst particle with a significant concentration of iron nodulation on the catalyst surface. The third picture shows a low boiling eutectic formed in the presence of an alkali metal like Ca or Na and is the severest form of iron poisoning.
David Hunt (Grace Davison)
Grace receives E-cat samples for most of the FCC units operating worldwide. The figure below shows the distribution of average equilibrium catalyst Fe levels for 2010 for all FCC units that have provided E-cat samples to Grace. Mean Fe levels are 0.57 wt% and the highest Fe level in one unit is 1.36 wt%.
Iron can be detrimental to the unit in many ways including bottoms conversion, catalyst circulation stability and SOx emissions.
Yaluris (1) showed using an Electron Probe Micro-Analysis (EMPA) technique that iron from organic iron sources is primarily a catalyst surface contaminant. Yaluris also used scanning electron microscopy and optical microscopy techniques to confirm Fe is a surface contaminant. The figure below is an EMPA image of an FCC catalyst particle cross section. Warmer colors on the surface of the particle confirm that Fe and CaO are primarily surface contaminants. EMPA Image of Two FCC Catalyst Particles
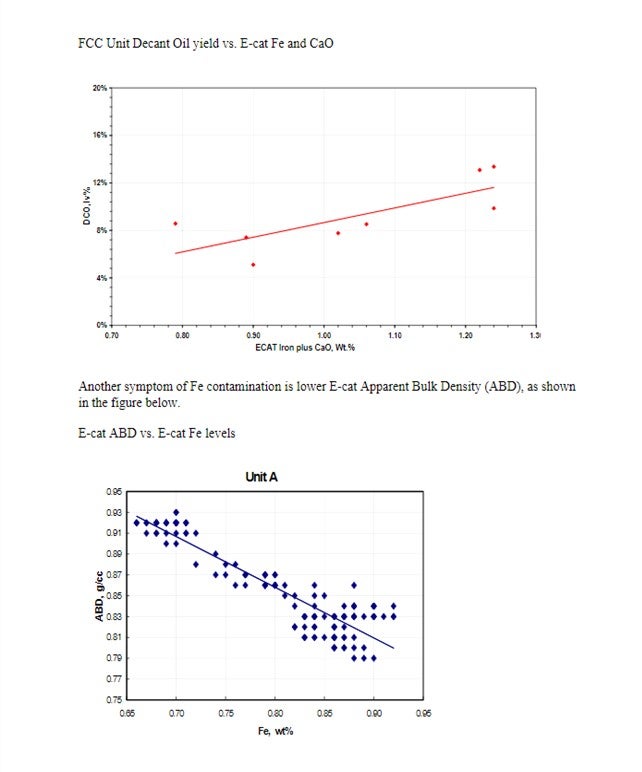
Yaluris (1) discussed how Fe contamination can lead to pore closure and nodule formation. The presence of Na and CaO can act as fluxing agents, aggravating the effect of Fe. The figure below shows Decant Oil or Main Fractionator bottoms yield vs. E-cat Fe plus CaO levels. Decant Oil increases at the higher contaminant levels due to the damaged catalyst pore structure.