

Question 64: What are the impacts on coker operation (yields, capacity, energy, coke quality) of excess VGO (1000F-) in the feed?
Jeff Lewellen (HollyFrontier)
Our El Dorado facility has transitioned from a 950o F HVGO/VTB cut point coker feed to a +1075 F while maintaining a fairly constant feed rate to the delayed coker unit. Our experience has seen coke and off-gas yield increase while HCGO yield decreases.
Our Conclusions:
• Yields – VGO range material is a relatively small contributor to coke yield in the unit. Between meter error and coke yield estimates, we have been unsuccessful in quantifying the exact yield impact.
• Capacity - Depending upon unit constraints, additional VGO occupies feed volume in the unit that could be used as VTB/residuum feed.
• Energy – The major impact is increased heater firing due to energy required to vaporize the excess VGO. This may also increase required drum temperatures to achieve equivalent VCM% results.
• Coke quality - Additional VGO may act similar to adding internal recycle to the unit. Although generally not aromatic, it could shift coke from shot to sponge coke. However, this is much more crude composition, drum velocity/pressure dependent.
Rajkumar Ghosh (Indian Oil Corporation)
Excess VGO in Coker feed is obviously not a desirable situation as it amounts to down gradation of straight run product. In one of our old refineries, we run a small Coker with long residue (RCO) as feed. Based on the experience there, the Impact of excess VGO in feed on Coker operation is explained as below:
a. Yield: The VGO part in the feed will have a free ride to the fractionator, thereby numerically reflecting higher distillate on Coker feed and consequent reduction in coke make. However, increase in coke drum vapor velocity will force higher pressure operation to prevent foam-over, leading to higher coke make from the residue part of the feed to the unit. The extent of increase in pressure will be dictated by the amount of VGO in feed.
b. Capacity: In the VR only case operation, if the feed to Coker is limited by Coke drum Capacities, then we certainly have a case for processing higher throughput in the excess VGO case, due to lower overall coke make. However, in such a case, Coke drum vapor velocity will also have to be cross checked and be maintained within the safe limit of 0.5 ft/sec. With lighter feed to Coker, the extent of vaporization in the heater tubes will be higher, leading to higher pressure drop across the heater. Heater duty will increase and may impose capacity limitations. Further, HCGO section flooding in the fractionator, HCGO product and pumparound circuit limitations may also become reasons for capacity bottleneck.
c. Energy: Excess VGO in feed will require higher heater duty. This may impose heater limitation with consequent lower COT. Lowering recycle under such a situation may help. However, it may result in higher HCGO CCR due to inadequate internal reflux in the wash zone. If HCGO circuit is not limiting, some of the heat can be recovered back into feed due to higher HCGO make.
d. Coke Quality: With the reduced wt% of asphaltenes, resins and metals in the feed, the coke quality will tend to improve. All the green coke produced with RCO feed is expected to be sponge coke with moderate VCM. Depending on the feed Sulfur content, the coke can be graded into Anode grade.
Eberhard Lucke (Commonwealth E&C)
Delayed Cokers are built to process residue, not gasoil. Excess VGO in the coker feed will only replace residue in the feed and will cause downgrading of almost all VGO to HCGO. HCGO yields will increase accordingly. The charge heater may benefit slightly from increased vaporization and lower fouling rates in the tubes. The coke may see an increase in VCM and may get a little softer, but this can be compensated by correct steam stripping.
Year
2011
Process
Question 101: What analytical methods can distinguish between organic and inorganic iron (Fe) compounds in the feed? What type of iron, organic or inorganic, affects catalyst performance? Considering the relatively long reaction residence time of most laboratory test units used to measure activity, will activity testing properly reflect the actual in-FCCU activity under conditions of Fe contamination? What is your best method to monitor the catalyst performance under Fe contamination? Is ther
Dwight Agnello-Dean (BP)
We have not routinely attempted to identify the organic and inorganic iron components in our feeds. An internal expert suggested two approaches. First to determine the organic iron using ICP-OES, then wash the same sample with DI water, or slightly acidified water, and utilizing atomic absorption, determine the inorganic iron. The second approach is to determine total iron utilizing X-Ray, ICP or Atomic Absorption. Following this step remove the solids and water soluble, which would contain the inorganic iron, and rerun the hydrocarbon sample to determine the organic iron. The difference between total iron and organic iron is the inorganic iron.
As far as which form of iron affects catalyst performance, we follow the general consensus that organic iron is the issue and of primary interest. Over the last decade we have experienced catalyst performance issues that were correlated with elevated iron on the catalyst. During these events, ecat testing did not indicate an appropriate drop-in catalyst activity, which supports the questioner’s point that ecat program test methods are not adequate for this purpose. The symptoms we do look for are loss in bottoms upgrading (higher DCO yields), a drop in catalyst bulk density (ABD), a change in fluidization properties, potential circulation issues, and of course elevated iron on ecat. Across our units we don’t have a single critical iron level where we would expect problems because we consider this to be impacted by both the catalyst and the feedstock. Therefore, our current practices are to monitor our normal iron on ecat level and begin looking for other symptoms if we see the iron increase 0.3 wt.% over normal. For the units I am most closely associated with I expect to stay below 0.8 wt% iron. These units process very clean VGO feeds.
Ray Fletcher (Intercat)
Testing methods for feed stock analyses may be found in ASTM D7691 - 11 which include standard test methods for multi-element analysis of crude oils using inductively coupled plasma atomic emission spectrometry (ICP-AES). We believe that the high-performance liquid chromatography ICP-AES may be better at distinguishing organic and inorganic metal species.
It is widely accepted that organic iron in porphyries and naphthenates negatively affect the catalytic performance more than does inorganic iron.
The primary reason for the different performance effects between organic and inorganic iron is related to the size of these molecules. It is believed that small inorganic iron species are able to penetrate into the catalyst particle in most cases and disperse easily. On the other hand, large organic iron bearing molecules are typically sterically hindered and thus are unable to penetrate within the FCC catalyst particle. These molecules tend to deposit on the particle surface forming a barrier to diffusion. These iron rich layers are often several microns thick having a very rough nodular structure.
Our R&D team has found that the ECAT surface contaminated by organic iron contains a very dense amorphous iron rich layer which seals the macro, meso and micro-pores of catalyst. There is no penetration and reaction found at the interface between the iron layer and catalyst. The outer surface of an iron poisoned catalyst particle consists of a dense amorphous aluminosilicate phase with polycrystalline magnetite (Fe3O4) nanoparticles on top.
Most laboratory deactivation and testing methodologies used today are unable to accurately predict the effect of iron poisoning in a commercial unit. FCC catalyst suppliers have been active in developing special deactivation conditions to enable more accurate prediction capability with iron poisoning. None of these deactivation procedures have yet been able to accurately model an iron contaminated unit. The one test unit which may be capable of distinguishing iron effects is the circulating pilot plant. However, due to the sample sizes involved and the time & cost commitments few refiners have been willing to carry out extensive testing with this equipment.
The best method for monitoring iron poisoning is systematic and detailed unit monitoring. The focus is on "add-on iron". Most FCC catalysts contain 0.2-0.4 wt% iron depending upon the kaolin content and source. The add-on iron is the equilibrium iron less the fresh iron. Most catalyst systems are capable of handling +0.3 wt% add-on iron before negative effects are observed. Catalysts with alumina-based binding systems are usually capable of absorbing higher levels of iron at approximately 0.4-0.5 wt%.
The actual amount of iron the equilibrium catalyst is capable of absorbing without negative impact is directly related to the concentration of all contaminant metals including: nickel, vanadium, sodium, calcium plus iron. Most catalyst systems begin to observe negative effects when the total metal levels exceed 13,000 to 15,000 ppm. There are a few FCC units which regularly defy this rule of thumb having iron levels exceeding one wt%. These units are believed to be exceptions rather than the rule.
Iron nodules have been observed on the surface of equilibrium catalysts which have undergone high levels of iron contamination. The net result of these nodules has been poor blockage with a corresponding loss in bottoms conversion plus an apparent drop in ABD due to altered packing efficiencies. Many times, in spite of a lower ABD the fluidization characteristics of the unit have deteriorated. Additionally, as stated in question #99, step change increases in iron have been observed to precipitate that changes in SOx emissions. These step change increases in emissions are easily controlled by SOx reducing additive.
It is recommended that the process engineer monitor closely the levels of add-on iron and total contaminant metals. Both of these variables may be plotted against bottoms conversion or conversion. The refiner may then draw their own conclusion regarding maximum allowable iron contamination. Three methodologies exist for combating iron excursions include: 1) flush catalyst, 2) higher fresh catalyst additions &/or 3) reformulation to a more iron tolerance catalyst system.
Finally, Intercat would like to propose an alternative explanation to the underlying mechanism leading to nodule formation in iron contaminated units. It has been observed that the composition of these nodules is not solely iron but is enriched with silica. Interestingly, one would expect that beneath the iron nodules there would be silica depleted regions within the catalyst particle. However, this is not the case. The composition of the catalyst directly beneath the iron nodule has equivalent silica concentrations as those regions not affected by these nodules. This leads us to hypothesize that iron acts as a nucleating site for silica/iron nodule formation. As stated earlier, these nodules have multiple negative impacts such as reduction in conversion, reduction in ABD, and occasionally, deterioration in fluidization characteristics. (Our thanks to Dr. Diddams for sharing this hypothesis with us.)
Ann Benoit (Grace Davison Refining Technologies)
Yaluris discussed that there are two types of iron. One type is particles of inorganic iron from hardware and is usually considered benign in FCC unit performance. The second type is organic based Fe potentially coming in with the feed and/or from hardware corrosion by naphthenic acids and other corrosive feed components. This type of iron can negatively impact unit performance. (1) ACE testing is a better technique to measure the conversion impact of organic based iron contaminated catalyst, compared to traditional fixed bed MAT testing. However, ACE testing should be used together with other tests to confirm iron poisoning.
Below are several methods that can be used to monitor catalyst performance under Fe contamination:
•Ecat analysis (Fe, Na, CaO, ABD, color)
•Scanning Electron Microscope imaging (SEM)
•Optical microscope
•Ecat diffusivity
A decline in unit performance such as, reduction in bottoms conversion, and/or poor catalyst circulation coupled with an increase in equilibrium catalyst Fe levels can indicate Fe poisoning. Yaluris discussed how pore closure and nodule formation can be potentially caused by iron contamination (1). Pore closure can negatively affect bottoms conversion in the unit. An excellent way to show the actual nodules is by Scanning Electron Microscope imaging (SEM). It is important to note that some nodules may not be a problem, but there is a problem when the nodules become obviously raised from the surface and all over the catalyst particle. A drop in ABD (apparent bulk density) on Ecat can indicate nodules formation due to iron poisoning as Ecat does not pack as densely. The ABD change, pore plugging and the potential for particles to stick together can negatively impact unit catalyst circulation.
Optical microscope is another method to indicate iron poisoning. Ecat samples with iron poisoning will show glassy reflections under an optical microscope with illumination. (1) The color of Ecat could potentially indicate high levels of Fe. Ecat samples can have a reddish brown tint when poisoned by iron.(1) In addition to Ecat Fe levels, Na and CaO should be monitored as well. Fe in the presence of Na and/or CaO can act as a fluxing agent which can aggravate the effects of Fe.(1)
Year
2011
Process

Question 59: What challenges have you faced from processing crudes that contain elevated levels of wax crystal modifiers or flow improver chemicals?
DION (GE Water & Process Technologies)
This is a complex question. There are many different chemical families that can be employed as either wax crystal modifiers or flow improvers. Flow improvers can be dragging reducers or pour point depressants. I recommend empirically measuring its impact. For instance, if the concern is the additives’ impact on desalter operations, then the additive can be easily tested in a laboratory desalter simulator. The emulsification tendency of the crude can be measured with and without the additive. All specialty chemical suppliers should have desalter simulators, most of which are portable. The testing can be conducted in the refinery’s laboratory, if desired.
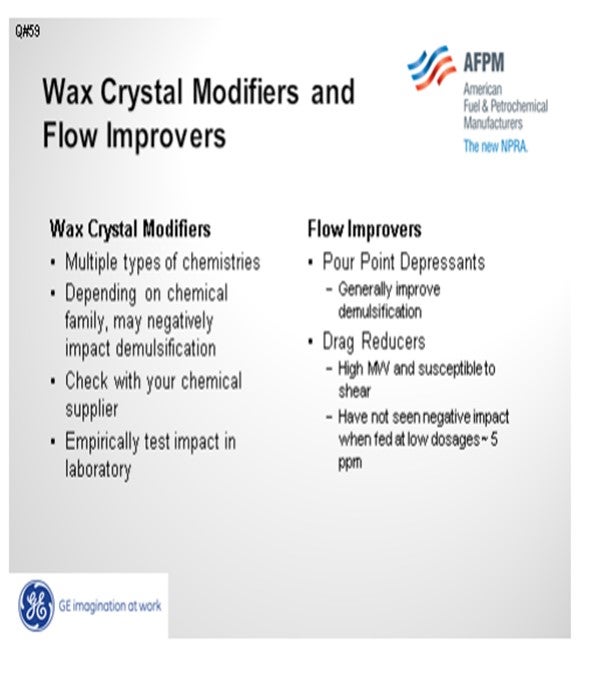
In general, the most common types of pour point depressants will be complementary or synergistic to demulsification. There are too many different chemical families that can be employed to make a general statement about whether wax crystal modifiers are synergistic or antagonistic to demulsification. It can be empirically determined. Drag reducers are very high molecular weight molecules. They are sensitive to shear and break into smaller molecules when they pass through pumps. The larger molecules that are not sheared should act similar to an asphaltene. In one refinery, we saw a situation where a drag reducer was overfed. The excess drag reducer precipitated in their raw crude tanks. When the tank was opened for corrosion inspection, they found a five- or six-inch thick deposit of an elastic, sticky material that had to be cut with shovels to get it out of the tank.
DION (GE Water & Process Technologies)
Wax crystal modifiers are typically amine oxides, amides or sulfonates. They are utilized to keep paraffins dispersed and reduce wax deposition. Flow improvers generally fall into two categories; pour point depressants and drag reducers. They are typically stearates, vinyl acetate copolymers, polyacrylates or polymeric alpha olefins. Pour point depressants typically promote the formation of compact, three dimensional crystals as the crude oil cools. The compact crystals decrease the pour point of the oil and improve low temperature flow properties. Flow improver chemicals are typically extremely large molecular weight materials. Like asphaltenes, they can precipitate to an oil/water interface and stabilize emulsions. There have been no noticeable desalter performance issues at dose rates of approximately 5 ppm. When dose rates are roughly 15 ppm to 25 ppm, desalter upsets may occur. In at least one refinery, a six inch layer of sticky elastic, caulk-like material has been observed on the bottom of the tanks and believed to be due to flow improver chemicals. In general, pour point depressants can improve emulsion resolution, while on the other hand paraffin inhibitors may have a deleterious effect. The exact effect would require either more specific information on the chemistry or empirical testing results.
BASHAM (Marathon Petroleum Corporation)
We have run crudes with flow improver at Marathon Petroleum Company’s Catlettsburg refinery for four to five years now with no known issues on our crude units.
DENNIS HAYNES (Nalco Energy Services)
In the past, there were some types of these chemistries in oil production that were reported to have problems on oil-water separation in desalting at the refinery; however, in recent history, improvements seem to have been made, and the products we have been asked to review for other companies have not shown adverse impacts regarding emulsification. If there is an indication that a new product is being used, evaluation on downstream impacts is recommended.
SAM LORDO (Nalco Energy Services) There have been a few reports of impacts on the amps/volts from crudes treated with pour point depressants. The impact was minor but noticeable in that additional power-draw was observable.
Year
2012
Process