
Question 60: With today’s current variety of new crudes, synthetic crudes, tight oils, bio-based streams, opportunity feeds, etc. that find their way to the FCCU, what new metal contaminants (excluding nickel, vanadium, iron, and sodium) do you see that impact catalyst and FCC performance?
FEDERSPIEL (W.R. Grace & Co.)
With the next few slides, I will show you some data we compiled. I will explain the data as I talk through the slides. On the first slide are histograms of data that is sent to us from FCC units of both Grace customers and non-Grace customers. Each unit is represented by one number. Looking at the number of units on the Y axis, you see that they are grouped into different contamination levels. The histogram shows globally where we have received data for the year 2017 and also gives you an idea of the distribution of those contaminants across the industry.
The question asked: With these new types of feeds that are coming in, what new metal contaminants are we seeing? At Grace, we have broken them down into three different types of groups. We group it out as alkaline and alkaline earth metals, which went into the potassium, magnesium, calcium, and barium. They tend to act similar to sodium in that they will ultimately destroy zeolite. And then at high enough concentrations, they can help aid the forming of eutectics, which can further degrade access to the catalyst diffusion to the catalyst sites or even cause service and more morphology problems.
There are other metals which we classify such as molybdenum, cobalt, copper, zinc, and lead. These metals often act with dehydrogenation effects similar to nickel and vanadium. So, they are tied, again, to the traditional metal contaminants we have been studying for a while. Molybdenum is interesting in that it is particularly destructive but not particularly common. If you look at the distribution of units, you see that not very many units have any kind of real concentration of molybdenum on them, but that molybdenum is said to be five to 10 times dehydrogenating as nickel and vanadium. However, the concentrations are so little that they do not really impact FCC unit performance.
Lead is one of those metals that has been around. It is known to reduce promoter effectiveness, even at levels of around 100 ppm. But if you build up lead, you can start to impact the activity of the catalyst when the lead reaches levels around 800 ppm. And again, by looking at the distribution, you can see that there are just not many units out there with very high concentrations of lead, at least in the activity reduction zone. There are a few where the lead could be impacting the promoter effectiveness. We do see other elements – including phosphorous, silicon, mercury and arsenic – present in FCC e-cat (equilibrium catalyst).
With respect to the time, I will just quickly talk about arsenic. It is interesting because depending on how the lab that you are using is analyzing for it, you can actually get a false positive or a false high result. The reason is that the method can confuse lanthanum, which is present on FCC catalyst, as arsenic because the peaks are overlapped. So, there is a specific type of ICP (inductively coupled plasma) mass spectroscopy that you should be using if you are trying to analyze for arsenic, which is present in some crudes and imported feedstocks. Arsenic can produce some bad downstream effects.
DINKEL [Marathon Petroleum Corporation (MPC)]
I will just confirm our experience from Mike’s laundry list of contaminants. We have seen some barium show up in units that process tight oil, but the concentrations were so low that we did not see any impact to unit operation.
ALEXIS SHACKLEFORD (BASF Corporation)
For barium, BASF has done some laboratory tests looking at the impacts. As long as there is a rare-earth on the catalysts, the impacts are minimal, if any. Silicon normally comes from the coke unit (recycle) due to the antifoams used. FCC catalysts already contain a high amount of Si, and additional Si (silicon) will have no impact. You do not have any of the concerns you would for hydrotreating. Now, arsenic is volatile under FCC conditions. Due to its volatility, it does not deposit on the catalyst and has no negative effects. You will see it downstream in the propylene steam as they both have similar boiling points. If your propylene stream is routed to any chemical operations, you must remove that arsenic because it will kill the catalysts. There are plenty of solutions for arsenic removal in these streams.
MICHAEL FEDERSPIEL (W.R. Grace & Co.)
In addition to the “standard” contaminants of nickel, vanadium, iron, and sodium, there are a variety of other feed contaminants that can impact FCC performance. For example, tight oils (also known as shale oils) can contain high levels of potassium, magnesium and calcium in addition to the iron normally found in them8. While bio-based feedstocks are not yet widely processed in commercial units, they would be expected to contain higher levels of calcium, sodium, magnesium, and potassium than conventional feed sources since these elements all play an important role in biological systems. High levels of phosphorous have been found on synthetic crudes. Opportunity crudes can contain a variety of non-standard metals including copper, zinc, silicon, mercury, and arsenic. Molybdenum and cobalt can also find their way into FCC feedstock. At times, it seems like every element in the periodic table can wind up in the FCC.
These metals can be considered in three groups: (a) alkali and earth alkaline metals, (b) other metals, and (c) other contaminants. For many elements, histograms of contaminant levels on e-cat are presented. These histograms are based on a worldwide survey of more than 270 FCC units, and the data is a one-year average for each unit of the e-cat samples tested.
Alkali and Earth Alkaline Metals
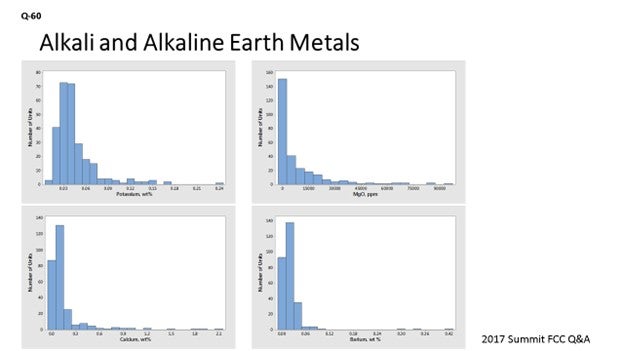
Similar to sodium, the alkali metal potassium will reduce activity by poisoning active sites and will also result in zeolite destruction. Alkaline metals in feed (such as calcium, magnesium and barium) will result in zeolite degradation similar to that seen with sodium. Classic work by Letzsch and Wallace9 found that on an added weight-percent basis, potassium is about 0.5 to 1.0 times as destructive as sodium and that calcium and magnesium are less destructive than sodium. Barium was found to be less destructive than the other alkaline earth metals. Calcium, in combination with iron, can be especially detrimental. As described in the answer to Question 44 at the 2009 NPRA Q&A, calcium – along with other elements such as iron and sodium – can act as a fluxing agent to form low melting-point phases on the surface of the catalyst. This could help the operation results in the collapse of the pore structure on the surface of the catalyst particle and a reduction in conversion since it is harder for feed molecules to enter the catalyst particle. As seen in Figure 1, levels of potassium on equilibrium catalyst are generally low, with the worldwide average at 0.05 wt% (weight percent).
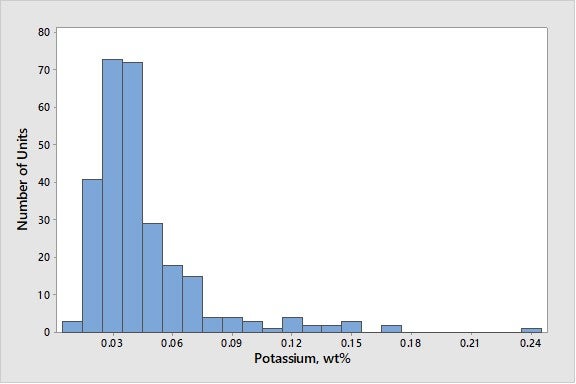
Figure 1. Average Concentrations of Potassium on E-Cat for FCC Units Worldwide
This level on e-cat contrasts with sodium which has an average level on e-cat of 0.26 wt%. Most magnesium in equilibrium catalyst comes from SOx-reduction additives or metals-trapping components instead of feed. Figure 2 presents a histogram of magnesium oxide concentration in e-cat for units worldwide.
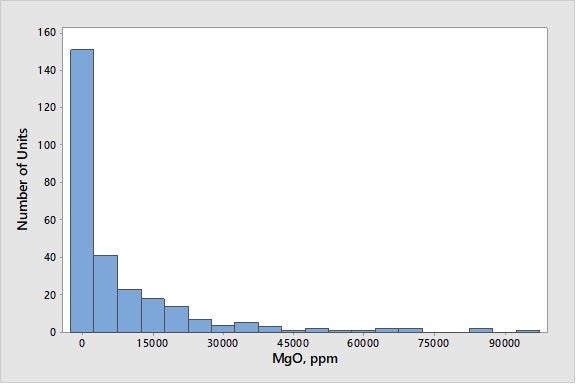
Figure 2. Average Magnesium Oxide Concentrations on E-Cat for FCC Units Worldwide
Calcium can come from feed, although there are a few units that use calcium containing additives. As seen in Figure 3, more than 90% of the world’s FCC units run at calcium levels below 0.5 wt% on e-cat.
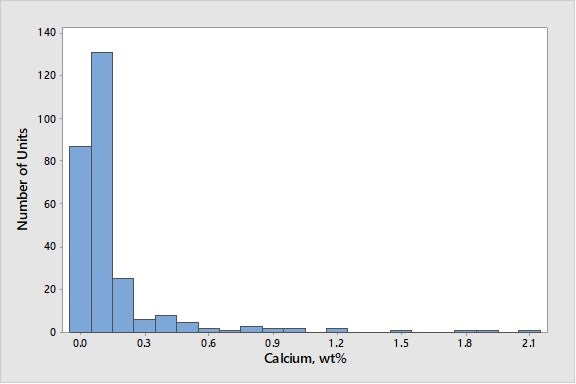
Figure 3. Average Calcium Concentrations on E-Cat for FCC Units Worldwide
As seen in Figure 4, barium levels are generally low, with 95% of the world’s FCC units at barium levels below 0.1 wt% on e-cat.
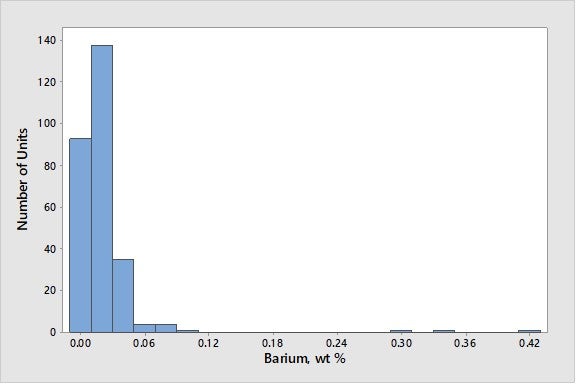
Figure 4. Average Concentrations of Barium on E-Cat for FCC Units Worldwide
Other Metals
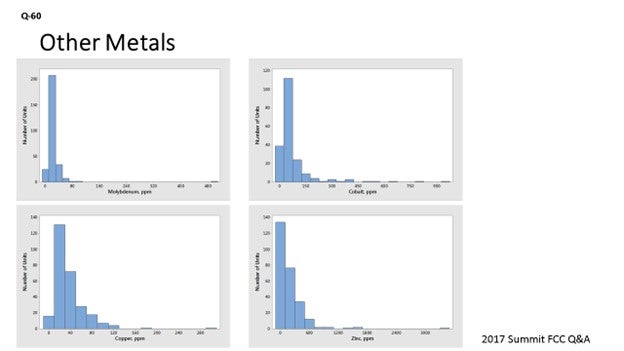
Many metals (like molybdenum, cobalt, copper, and zinc) act as dehydrogenation catalysts, like nickel and vanadium. Molybdenum is a rare feed contaminant that can cause zeolite destruction, as well as an increase in coke and hydrogen. It can be present in feed either from the starting crude oil or from carryover of hydroprocessing catalyst. While cases of molybdenum poisoning are rare, it can have a very detrimental effect. In one refinery, a severe increase in molybdenum, by 1700 ppmw (parts per million by weight), resulted in a six-number drop in e-cat MAT (microactivity test) – a tripling of the e-cat gas factor – and a more than 50% increase in the e-cat coke factor. In another refinery, an increase in molybdenum from 40 to 180 ppmw resulted in the doubling of hydrogen production in e-cat testing. While the detrimental effects of molybdenum will vary with regenerator conditions (full-burn versus partial-burn and temperature), as a rough approximation, molybdenum appears at least five times as active as vanadium on a weight basis. Fortunately, molybdenum is a rare contaminant in most units. As seen in Figure 5, with the exception of one unit, molybdenum levels on e-cat are below 100 ppmw.
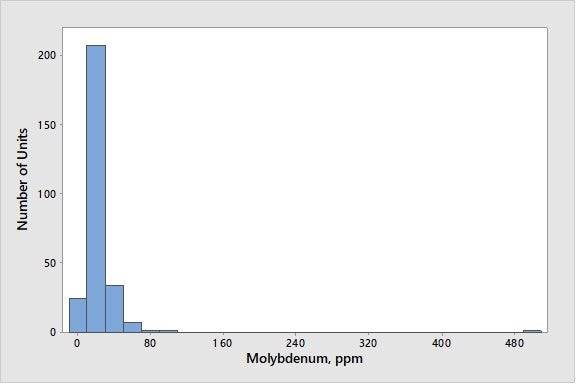
Figure 5. Average Concentrations of Molybdenum on E-Cat for FCC Units Worldwide
While cobalt is not typically found in the feed unless it comes in from hydrotreaters ahead of the FCCU, it can result in increased hydrogen and coke. As seen in Figure 6, cobalt levels are generally low, with 90% of the world’s FCC units at cobalt levels below 200 ppmw.
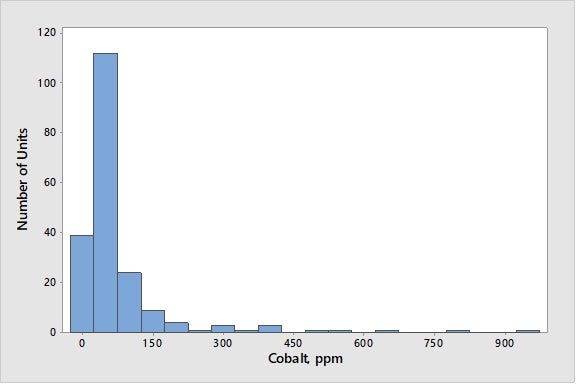
Figure 6. Average Concentrations of Cobalt on E-Cat for FCC Units Worldwide
The dehydrogenation activity of copper is typically about the same as that of nickel on a weight basis10. The copper content of most FCCU feeds is very low, so it is normally not a problem. As seen in Figure 7, copper levels are generally low, with 95% of the world’s FCC units at copper levels below 100 ppmw.
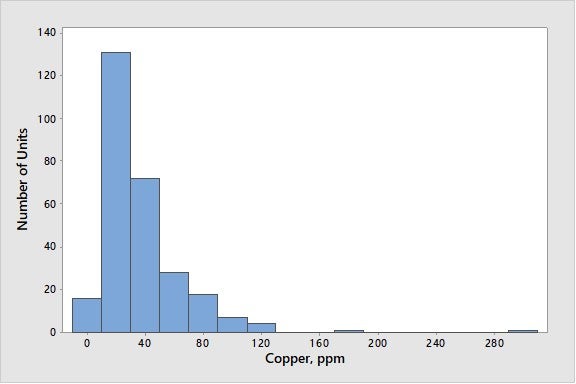
Figure 7. Average Concentrations of Copper on E-Cat for FCC Units Worldwide
Zinc from feed is another metal with dehydrogenation activity. In a 1996 NPRA Q&A, one respondent to Question 18 (about processing used lube oils) stated that he had found that zinc tended to have lower dehydrogenation activity than nickel. We have observed several North American units experience spikes of zinc on e-cat of 1,000 to 2,000 ppmw in the last two years, possibly from zinc additives in their crude slate. In addition to coming from feed, zinc is used in some gasoline sulfur-reduction additives; zinc from this source will also appear on e-cat reports. Zinc in gasoline sulfur-reduction additives does not have the dehydrogenation activity of zinc introduced from feedstock. Figure 8 presents average zinc levels on e-cat worldwide with known zinc-based GSR (gasoline sulfur reducing) additive users removed. As seen in Figure 8, 90% of FCC units have less than 500 ppmw zinc on e-cat.
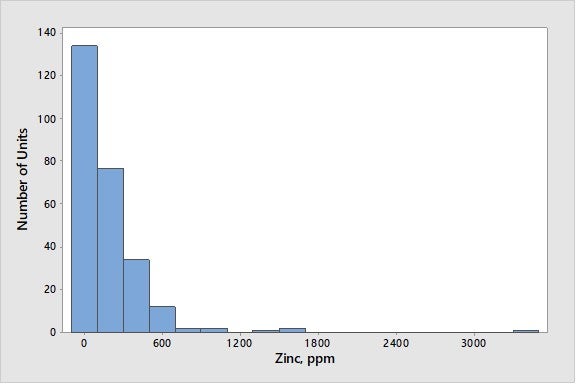
Figure 8. Average Concentration of Zinc on E-Cat for FCC Units Worldwide (with known Zinc-based GSR Additive Users Excluded)
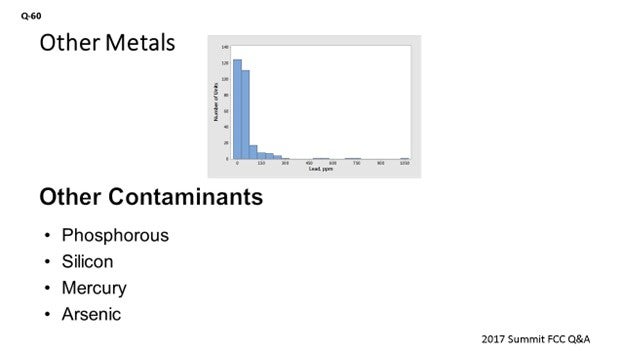
Lead can come from the source crude oil or – very rarely – from recycled aviation gasoline slop streams fed to the FCC. It is well known that lead can cause the deactivation of combustion promoter, which results in detrimental effects at levels of even 100 ppmw11. Work in 1987 established that in large enough concentrations on e-cat, lead can also cause a loss in catalyst activity and conversion. In that work, 800 ppmw lead resulted in a loss of 2 to 4 numbers of MAT activity12. Experience with equilibrium catalyst suggested that 1,000 ppmw lead would result in a loss of 1% conversion13. However, there are almost no units operating at these levels of lead in the industry today. Nine five percent of units are below 300 ppmw lead on e-cat, and 85% of units are below 100 ppmw lead on e-cat. Figure 9 presents industry average data for lead on e-cat.
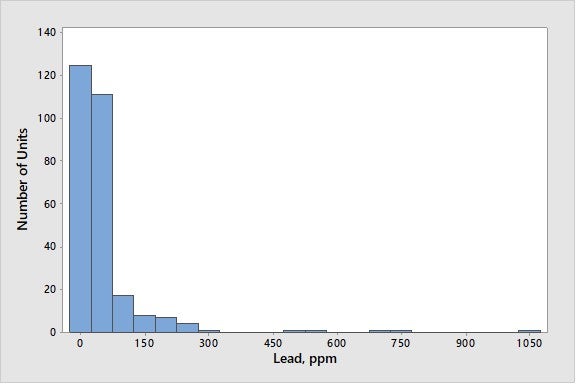
Figure 9. Average Concentrations of Lead on E-Cat for FCC Units Worldwide
Other Elements
High levels of phosphorous can be found in shale oils and in Western Canadian crudes. The phosphorous appears to come from fracking fluids and gelling agents used in well stimulation. In our experience, we have seen P2O5 (phosphorus pentoxide) on e-cat increase by up to 0.1 wt% with a change in FCC feedstock slate. The levels are not high enough to affect FCC catalyst, but the phosphorous is often a problem in the main fractionation tower and the hydrotreater. Questions 31, 36, and 65 from the 2013 AFPM Q&A address the effects of phosphorous in units other than the FCC.
Silicon can come from crude oil or antifoaming agents. Since silicon oxide is present in the composition of the base catalyst, we would not expect silicon from feed to have an effect on FCC catalyst and have not observed any effects. However, silicon is a significant poison for hydroprocessing catalysts. This topic has been discussed in earlier AFPM Q&A and Technology Forums14.
Mercury can be found in trace levels in many hydrocarbons. Under FCC conditions, mercury is very volatile and would not be expected to build up on FCC catalyst. While mercury would not affect FCC catalyst, it can concentrate in cooler downstream units. For example, there is a reported case of pooled mercury having been found in an FCC flue gas line during a unit shutdown15.
Arsenic is naturally found in crude oil. The arsenic compounds in FCC feedstock primarily react to arsine (AsH3); additionally, some arsenic leaves the unit in the liquid products. Arsenic is highly reactive towards nickel and noble metals, and arsenic compounds have a negative effect on the catalysts of downstream units for reactions such as polymerization, reforming, and hydrotreating16. Guard beds are often used to remove the arsenic-containing compounds and protect catalyst in downstream units. Arsenic in FCC feedstock has not been found to deactivate the cracking catalyst, probably because arsenic is not reactive towards the silica-alumina structure of the zeolite. Levels that Grace has seen for arsenic on e-cat are typically below 20 ppmw. An important consideration in measuring arsenic in e-cat and fines is the analysis method. Inductively coupled plasma atomic emission spectroscopy (ICP-AES) is not suitable for determining arsenic levels in e-cat since the lanthanum in the e-cat will interfere with the arsenic line such that incorrect high levels of arsenic will be reported. Difficulties with ICP-AES analysis – for samples with both arsenic and lanthanum – have been observed in other industries17. Preferred techniques for determining arsenic on e-cat and fines are inductively coupled plasma mass spectroscopy (ICP-MS) and neutron activation analysis (NAA). Potential interferences also exist in these two methods, and any lab doing analysis should be informed of the presence of lanthanum. The topic of arsenic in FCC is covered further in the answers to Question 4 from the 2016 APFM Cat Cracker Q&A.
BRYAN DINKEL [Marathon Petroleum Corporation (MPC)]
We have seen trace amounts of barium at one of our units, but the levels were low enough that there was no impact. Barium has been linked back to tight oils in literature discussion and in follow-up conversations with the catalyst supplier on this particular unit.
ALEXIS SHACKLEFORD (BASF Corporation)
Other contaminants that are seen include calcium (Ca), barium (Ba), potassium (K), phosphorus (P), mercury (Hg), arsenic (As), magnesium (Mg), and lead (Pb). The elements that are alkali metals or alkaline earth metals – Ca (calcium), Mg, and K (potassium) – will all act similarly to sodium, in terms of neutralizing acid cracking sites, if they come in contact with the feed. Ca and Mg can also be present in vanadium traps, although these chemicals do not cause adverse catalytic effects. Currently, Ca is showing up in greater quantities than before with new opportunity feeds. Mitigation strategies include improved desalting and increased catalyst addition rates to make up for the loss in activity or the use of flush catalyst. These metals, especially Ca, may plug catalyst pores, so be sure to use a catalyst with proper pore architecture. Barium can come in with some tight oil feeds and can be present in some vanadium traps. Barium shows no impact on activity if the catalyst contains rare-earth. Arsenic is still uncommon; but occasionally, it is seen and volatile under FCC conditions. It does not affect yields and leaves with the C3= stream where it will need to be removed as small quantities will poison petrochemical catalysts (more than 20 ppb). Phosphorus is found in ZSM-5 additives and some catalysts. If coming from the feed (found more prevalently in tight oil feeds), it can leave with the products or deposit on the catalyst; however, there are no adverse yield impacts. Lead is still uncommon but will poison CO promoters if they are present. Mercury is also still uncommon and will leave with the products, often in the heavy naphtha stream. If sent to a reforming unit, a few ppb of mercury will poison the precious metals catalyst and needs to be removed.
Year
2017
Process

Question 55: Given the expansion of the Industrial Internet of Things (IIoT), “Big Data”, cloud-based technologies, and advanced analytics, how are you applying these cutting-edge aspects into their work processes and toolkit to optimize FCC yield, reliability, and safety performance?
BHARGAVA (KBC Advanced Technologies, Inc.)
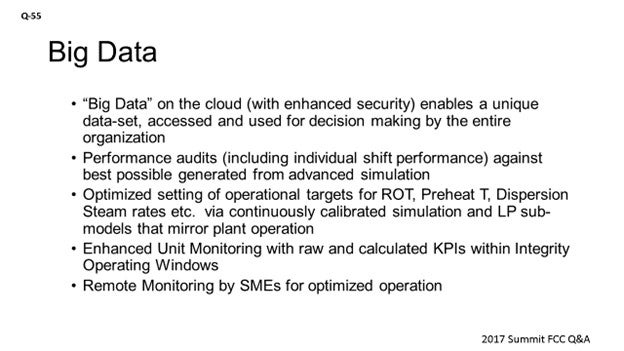
Some of the biggest challenges we have seen with “Big Data” revolve around security. Within the KBC software suite, we focus on security as our major differentiator. Given the connectors we have in The Cloud, we can now download the data from the refinery in a secure fashion and put it into one location; so, when people retrieve the data, they are all looking at one consistent set. That way, Yield Accounting is not looking at different numbers for closures from their perspective alone. The process engineer has his/her own mass balance that creates a lot of issues around the refinery.
The other big issue here is accessibility of the data: who inputs the data and who has the access to change it. All those issues must be addressed before you start using The Cloud to improve your data that is already on The Cloud. Because we are able to use this data and have access to lots of capacity, we are now able to micromanage, if you please, in terms of identifying and doing performance audits. We are even using this approach for shift performance information to see how one shift is doing against another. We can now get most of the information from The Cloud because we are able to store more data. This easy access to information has allowed simulation to move to a different level. We have been able to use the gobs of data we have from the DCS (distributed control system) to develop models that are more accurate. We can calibrate these models. In fact, in some of the real-time applications we have used, we have been able to calibrate the models on the hour. These models also allow us to set operational targets more accurately. That is about as far as we have gone with “Big Data”. So, it is all about finding your best possible operation and what you have done across the shift on a 24-hour average.
The benefits of having more data, sifting through it, and identifying good stable operation data to develop simulation models are all being used to generate LP (linear program) vectors, which are then used by the planners to help with crude selection and then do a gross optimization. From a yield perspective, it has definitely helped a lot. From a safety reliability standpoint, we now have enhanced unit monitoring. The old method of unit monitoring was to gather a number of KPIs (key performance indicators), have an operating range, and then try to optimize the unit in the operating envelope. We have used simulation as a way to help with some calculated variables that affected reliability of the unit. We have expanded the windows from operating envelopes to an integrity operating window to allow people to have a much better idea of or prediction capabilities on equipment failure.
Finally, having this data on The Cloud has allowed the SMEs (subject matter experts) from within the corporate level of the company to look at the same data set and help with the optimization of the unit from a remote location. You can also do this with third-party consulting companies to allow for another perspective with a fresh set of eyes to help make sure that the unit is running optimally on a daily basis.
SANJAY BHARGAVA (KBC Advanced Technologies)
With the advent of “Big Data” and cloud-based technologies, refiners are now able to harvest mega data in a process environment. Hundreds of thousands of values are being generated every few seconds to measure, monitor, control, and optimize plant operations. The major benefit of “Big Data” is to demystify the different plant data used by various parts of the organization by using with a common set of information that is utilized by all departments. In the modern refinery, the key is transparency in strategy, philosophy, and shared goals. The benefits are seen in reliability, safety, and operator consistency.
Also, refiners using in-house or third-party simulation technologies are able to extract precise information from these “lakes” of data about the performance and compare it to the best possible performance of the plant. Some companies are already tapping into this pool of information – through the use of simulations – to provide a robust means for selecting a set point or target setting of the independent variables.
The data is also being used in open-loop controls (and limited closed-loop controls) to help make advanced decisions to improve plant performance. The simulation models are being calibrated and updated to maintain prediction fidelity. The calibrated models are being used to generate LP vectors to keep the refiner’s planning models updated in order to mimic actual plant operation which will optimize feed and operating conditions, such as riser outlet temperature, feed preheat temperature, and main fractionator cutpoints in FCCs.
Advanced or enhanced unit monitoring applications are being used by refiners to convert raw data into key performance indicators. These applications are being linked to simulation technologies in real-time to generate calculated/derived key performance indicators focused on ensuring operation within integrity operating windows (IOWs) to help improve the plant reliability and safety and to maximize plant life by monitoring for corrosion, erosion, fouling, and accelerated mechanical equipment damage in order to allow for early action and prevention which will improve reliability and safety performance. These enhanced applications are also being used for predictive maintenance, as well as for monitoring the performance of operators between operating shifts and bringing shift performance closer to best possible operations, which will benefit all shift teams. These advanced unit monitoring applications, in addition to the cloud-based technologies with added security, are now being used by managers to view plant performance dashboards on their mobile devices. Finally, the data can also be used to perform remote monitoring by subject matter specialists – both within and outside of the organization – to optimize FCC operations. This monitoring can be now done due to enhanced security systems put into place to protect refinery data.
KATHERINE JONES (Honeywell UOP)
Honeywell recognizes the untapped potential of the industrial internet of things (IIoT) and sees these capabilities as the next revolution in industry:
-
IIoT enables users to leverage all data available including stranded data that, until now, has not readily used in business decisions.
-
Cloud-based solutions allows for a more collaborative environment to enable users to benefit from global expertise.
-
The use of big data and analytics, combined with the computing power of the Cloud, enables the investigation of large data sources and the discovery of new insights.
Maintaining high onstream efficiency and reliability are critical parameters for maximizing plant profitability. To help our customers maximize the use of their assets, Honeywell UOP offers a suite of cloud-based services with the Honeywell Connected Plant. One of these services, Process Reliability Advisor, combines plant data with UOP Process models that are tuned to current operation, plus a fault model which are cause-and-effect relationships and troubleshooting guides specific for the process. The service utilizes a cloud-based platform that supports big data analytics and machine learning to drive continual innovation.
Process Reliability Advisor enables our customer to:
-
Detect performance gaps early and perform mitigation steps,
-
Understand the unit’s current performance and asset utilization based on constraints, and
-
Promote learning and knowledge retention, leveraging UOP insights and context.
More information can be found at www.uop.com/cps including videos on how Process Reliability Advisor works.
Year
2017
Process

Question 64: What are the impacts on coker operation (yields, capacity, energy, coke quality) of excess VGO (1000F-) in the feed?
Jeff Lewellen (HollyFrontier)
Our El Dorado facility has transitioned from a 950o F HVGO/VTB cut point coker feed to a +1075 F while maintaining a fairly constant feed rate to the delayed coker unit. Our experience has seen coke and off-gas yield increase while HCGO yield decreases.
Our Conclusions:
• Yields – VGO range material is a relatively small contributor to coke yield in the unit. Between meter error and coke yield estimates, we have been unsuccessful in quantifying the exact yield impact.
• Capacity - Depending upon unit constraints, additional VGO occupies feed volume in the unit that could be used as VTB/residuum feed.
• Energy – The major impact is increased heater firing due to energy required to vaporize the excess VGO. This may also increase required drum temperatures to achieve equivalent VCM% results.
• Coke quality - Additional VGO may act similar to adding internal recycle to the unit. Although generally not aromatic, it could shift coke from shot to sponge coke. However, this is much more crude composition, drum velocity/pressure dependent.
Rajkumar Ghosh (Indian Oil Corporation)
Excess VGO in Coker feed is obviously not a desirable situation as it amounts to down gradation of straight run product. In one of our old refineries, we run a small Coker with long residue (RCO) as feed. Based on the experience there, the Impact of excess VGO in feed on Coker operation is explained as below:
a. Yield: The VGO part in the feed will have a free ride to the fractionator, thereby numerically reflecting higher distillate on Coker feed and consequent reduction in coke make. However, increase in coke drum vapor velocity will force higher pressure operation to prevent foam-over, leading to higher coke make from the residue part of the feed to the unit. The extent of increase in pressure will be dictated by the amount of VGO in feed.
b. Capacity: In the VR only case operation, if the feed to Coker is limited by Coke drum Capacities, then we certainly have a case for processing higher throughput in the excess VGO case, due to lower overall coke make. However, in such a case, Coke drum vapor velocity will also have to be cross checked and be maintained within the safe limit of 0.5 ft/sec. With lighter feed to Coker, the extent of vaporization in the heater tubes will be higher, leading to higher pressure drop across the heater. Heater duty will increase and may impose capacity limitations. Further, HCGO section flooding in the fractionator, HCGO product and pumparound circuit limitations may also become reasons for capacity bottleneck.
c. Energy: Excess VGO in feed will require higher heater duty. This may impose heater limitation with consequent lower COT. Lowering recycle under such a situation may help. However, it may result in higher HCGO CCR due to inadequate internal reflux in the wash zone. If HCGO circuit is not limiting, some of the heat can be recovered back into feed due to higher HCGO make.
d. Coke Quality: With the reduced wt% of asphaltenes, resins and metals in the feed, the coke quality will tend to improve. All the green coke produced with RCO feed is expected to be sponge coke with moderate VCM. Depending on the feed Sulfur content, the coke can be graded into Anode grade.
Eberhard Lucke (Commonwealth E&C)
Delayed Cokers are built to process residue, not gasoil. Excess VGO in the coker feed will only replace residue in the feed and will cause downgrading of almost all VGO to HCGO. HCGO yields will increase accordingly. The charge heater may benefit slightly from increased vaporization and lower fouling rates in the tubes. The coke may see an increase in VCM and may get a little softer, but this can be compensated by correct steam stripping.
Year
2011
Process
Question 59: What challenges have you faced from processing crudes that contain elevated levels of wax crystal modifiers or flow improver chemicals?
DION (GE Water & Process Technologies)
This is a complex question. There are many different chemical families that can be employed as either wax crystal modifiers or flow improvers. Flow improvers can be dragging reducers or pour point depressants. I recommend empirically measuring its impact. For instance, if the concern is the additives’ impact on desalter operations, then the additive can be easily tested in a laboratory desalter simulator. The emulsification tendency of the crude can be measured with and without the additive. All specialty chemical suppliers should have desalter simulators, most of which are portable. The testing can be conducted in the refinery’s laboratory, if desired.
In general, the most common types of pour point depressants will be complementary or synergistic to demulsification. There are too many different chemical families that can be employed to make a general statement about whether wax crystal modifiers are synergistic or antagonistic to demulsification. It can be empirically determined. Drag reducers are very high molecular weight molecules. They are sensitive to shear and break into smaller molecules when they pass through pumps. The larger molecules that are not sheared should act similar to an asphaltene. In one refinery, we saw a situation where a drag reducer was overfed. The excess drag reducer precipitated in their raw crude tanks. When the tank was opened for corrosion inspection, they found a five- or six-inch thick deposit of an elastic, sticky material that had to be cut with shovels to get it out of the tank.
DION (GE Water & Process Technologies)
Wax crystal modifiers are typically amine oxides, amides or sulfonates. They are utilized to keep paraffins dispersed and reduce wax deposition. Flow improvers generally fall into two categories; pour point depressants and drag reducers. They are typically stearates, vinyl acetate copolymers, polyacrylates or polymeric alpha olefins. Pour point depressants typically promote the formation of compact, three dimensional crystals as the crude oil cools. The compact crystals decrease the pour point of the oil and improve low temperature flow properties. Flow improver chemicals are typically extremely large molecular weight materials. Like asphaltenes, they can precipitate to an oil/water interface and stabilize emulsions. There have been no noticeable desalter performance issues at dose rates of approximately 5 ppm. When dose rates are roughly 15 ppm to 25 ppm, desalter upsets may occur. In at least one refinery, a six inch layer of sticky elastic, caulk-like material has been observed on the bottom of the tanks and believed to be due to flow improver chemicals. In general, pour point depressants can improve emulsion resolution, while on the other hand paraffin inhibitors may have a deleterious effect. The exact effect would require either more specific information on the chemistry or empirical testing results.
BASHAM (Marathon Petroleum Corporation)
We have run crudes with flow improver at Marathon Petroleum Company’s Catlettsburg refinery for four to five years now with no known issues on our crude units.
DENNIS HAYNES (Nalco Energy Services)
In the past, there were some types of these chemistries in oil production that were reported to have problems on oil-water separation in desalting at the refinery; however, in recent history, improvements seem to have been made, and the products we have been asked to review for other companies have not shown adverse impacts regarding emulsification. If there is an indication that a new product is being used, evaluation on downstream impacts is recommended.
SAM LORDO (Nalco Energy Services) There have been a few reports of impacts on the amps/volts from crudes treated with pour point depressants. The impact was minor but noticeable in that additional power-draw was observable.
Year
2012
Process