The biofuel industry, facing poor margins due to overproduction and declining exports, is trying various tactics to force more ethanol and biodiesel into the U.S. fuel supply. They currently claim that small refinery exemptions (SREs) — critical tools protecting small fuel manufacturing facilities from disproportionate economic harm brought on by the federal Renewable Fuel Standard (RFS) — are “destroying demand” for biofuels.
However, U.S. Energy Information Administration data shows no evidence of ethanol or biodiesel demand destruction this year versus last year (see data below). While SREs may have impacted the price of Renewable Identification Numbers (RINs), they have not impacted renewable fuels consumption. In fact, ethanol and biodiesel consumption are up this year compared to previous years.
Reallocating exempted 2018 RFS volume obligations, as the biofuel industry is encouraging the administration to do, would not be expected to impact renewable fuels consumption — but it would likely raise the cost of RINs and RFS compliance for fuel manufacturers and adversely affect small refineries that have demonstrated economic harm.
The current SRE policy works for refiners with no impact to farmers and should be maintained.
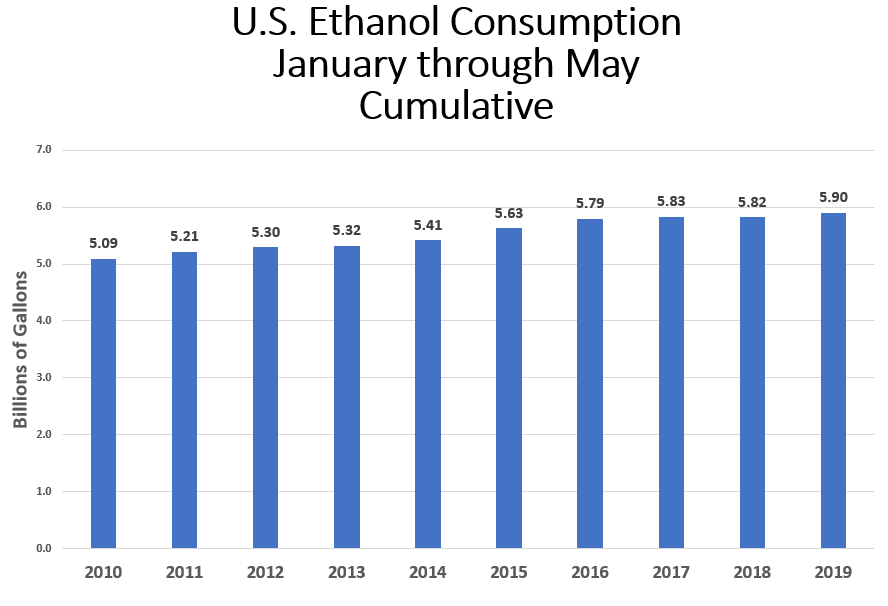
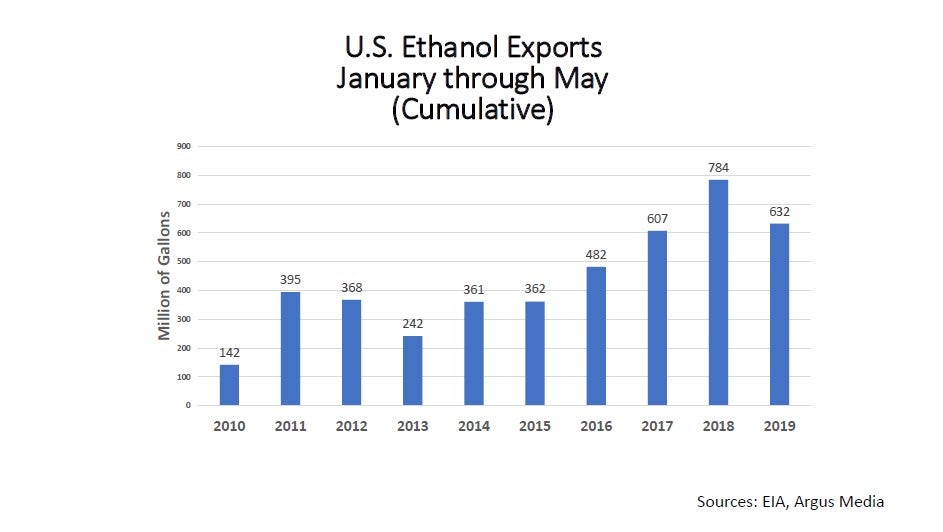
Total consumption of ethanol is up for the first five months of 2019 as compared with all prior years, suggesting there has not been ethanol demand destruction from Small Refinery Exemptions (SREs) granted for years prior to 2018.
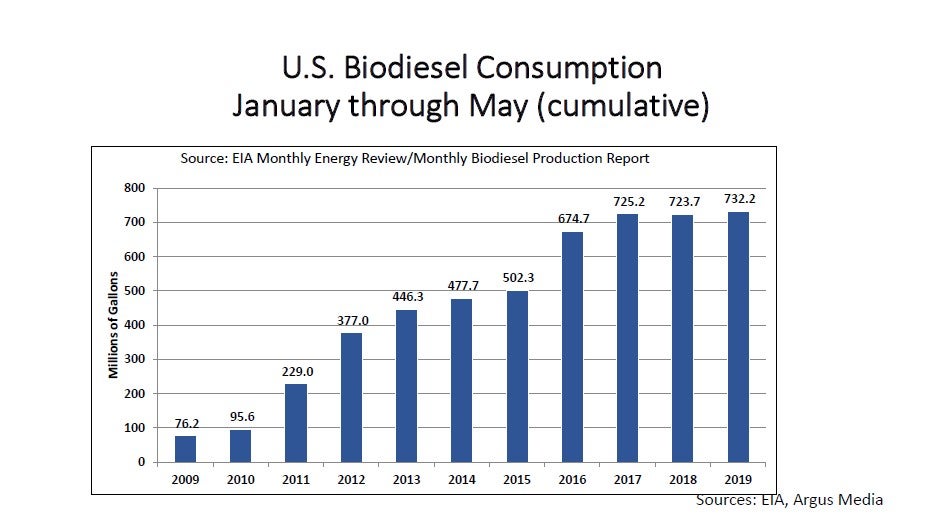
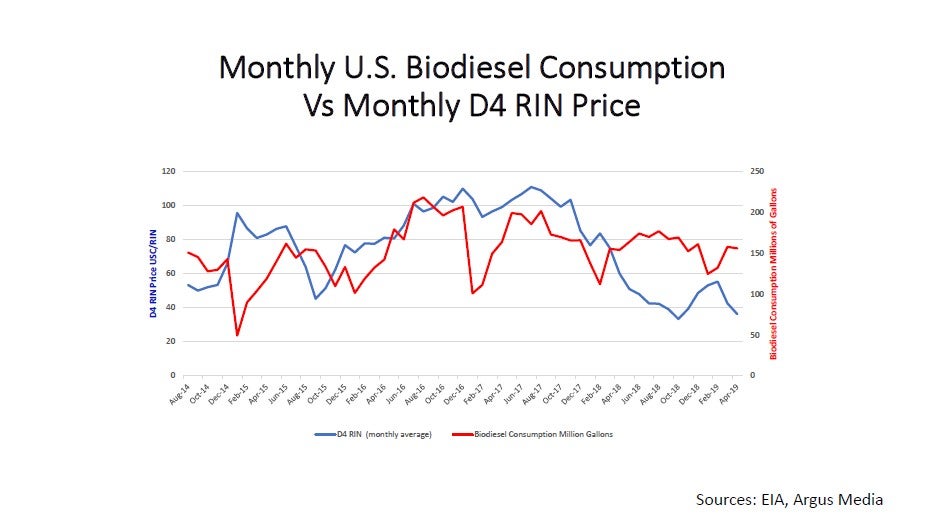
Biodiesel consumption for the first 5 months of 2019 is up versus all prior years, suggesting there has not been biodiesel demand destruction from SREs granted for years prior to 2018.
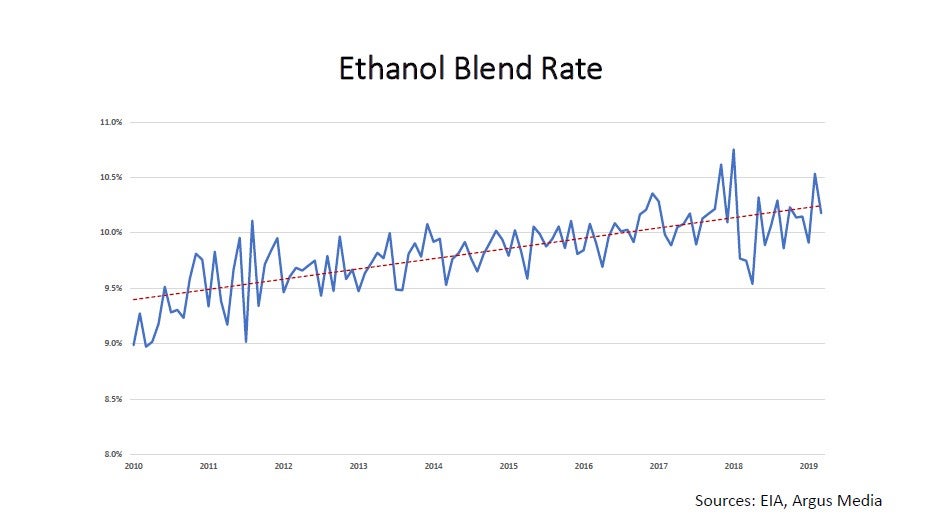
A simple linear trend line applied to ethanol content of gasoline suggests it is increasing.
Exports of ethanol are down by about 150 million gallons as compared with 2018.
A comparison of current year average monthly D4 RIN price to monthly biodiesel consumption does not reveal a strong relationship. It shows periods of possible positive correlation but also periods of possible negative correlation.
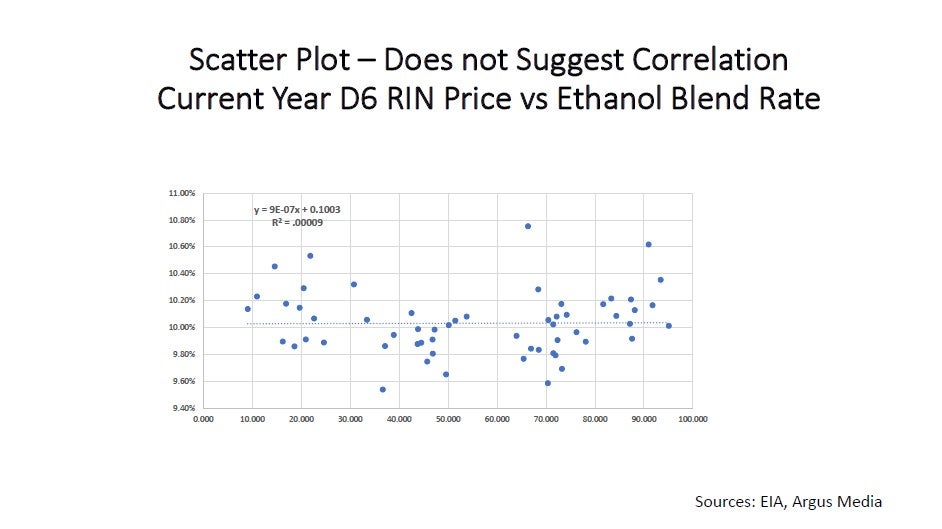
A scatter plot of D6 RIN prices against the ethanol blend rate reveals that there is no correlation between D6 RIN prices and ethanol blending.
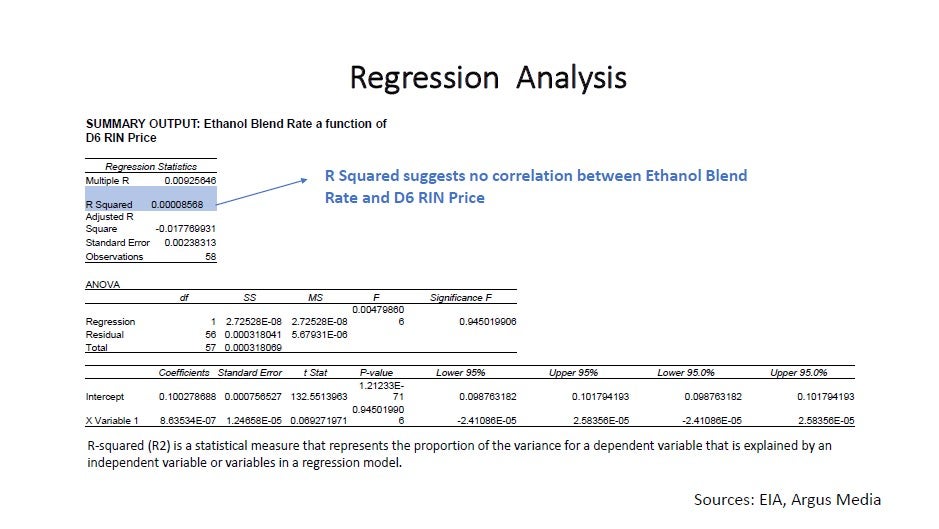
A regression analysis of D6 RIN price and the ethanol blend rate affirms no correlation – R squared of .00009
A scatter plot of D4 RIN price against biodiesel consumption does not reveal a strong relationship between D4 RIN price and biodiesel consumption.
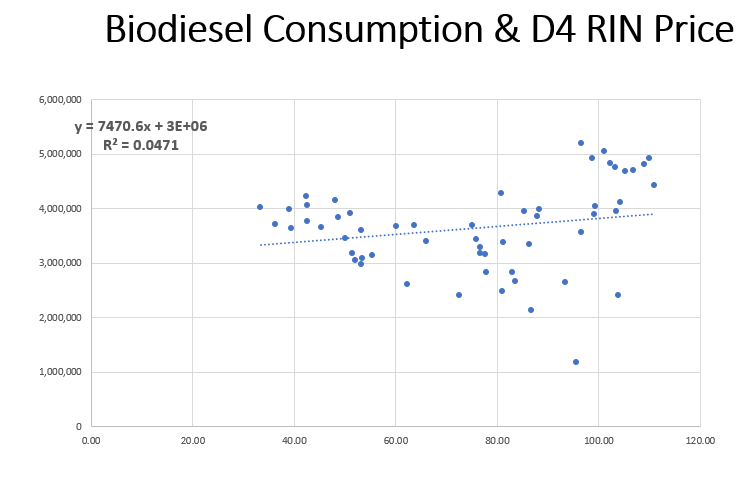
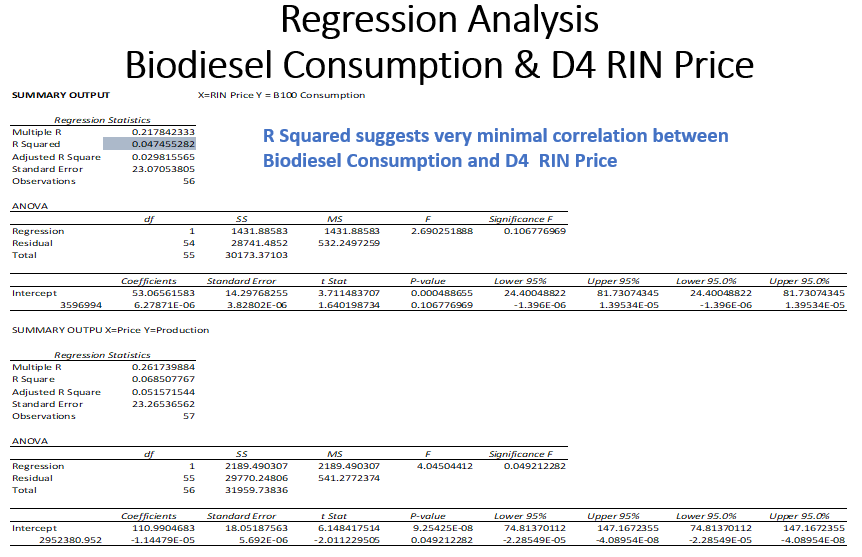
A regression analysis suggests an R Squared of ~.05 — almost no correlation.
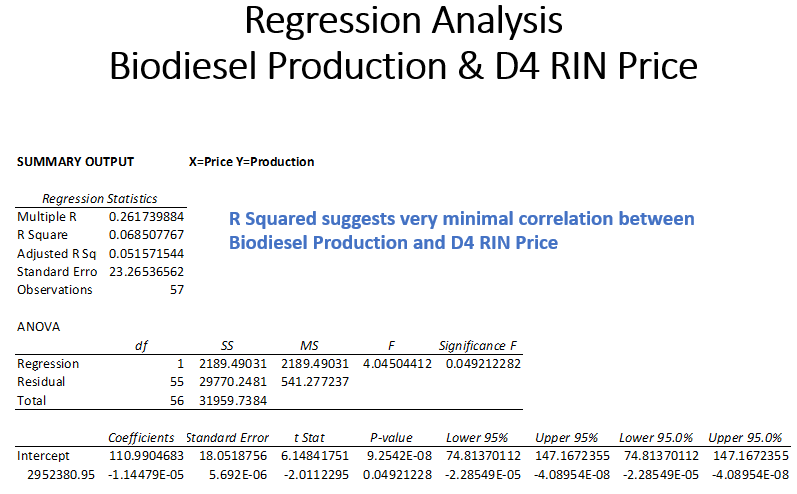
A scatter plot of D4 RIN price against biodiesel production does not reveal a strong or consistent correlation between D4 RIN price and biodiesel production.
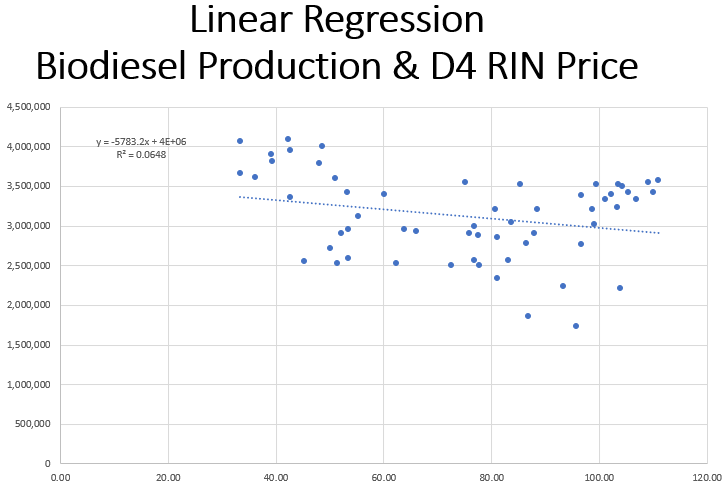
A regression analysis suggests an R Squared of .06 — a very minimal correlation.