Breakout Sessions - Continued
Track 1 – Process Safety Alarm Management
Track 2 – Industrial Hygiene
Track 3 – Contractor Onboarding
Track 4 – Drones
Track 5 – Distinguished Safety Award Recipient Panel
Session Start End
-
FOOTE (CHS Inc.)
Unreliable ESP dumping can lead to shorting out of the transformer rectifiers and the associated missions troubled by losing a cell of your ESP. Also, inconsistent dumping can put operators directly in harm’s way just since they are not consistent in the way they dump; and then indirectly, if the dumping leads to unit shutdown which will expose them during the shutdown. So, reliable operation of those hoppers is important.
At CHS, we have two dry ESPs on both of our operating units. We have not really noticed a difference. That catalyst morphology has much to do with whether they dump or not; but it is an unrefined operation, so I cannot really speak about it. What I can tell you is that as you let the catalyst accumulate in that hopper, it forms an insulating barrier. The thicker that insulating barrier gets, the more chance you will have for a temperature gradient across that barrier to be less than the bulk temperature of the ESP. So, as you let it build, the likelihood of condensation increases dramatically. Condensation is the leading cause of catalyst hopper issues.
Now I will talk about the importance of proper design and operation of ESP hoppers to ensure that they dump correctly. Insulation is important on your hoppers. Pay very close attention to manufacturer’s recommendations around the corners. The contractors will often get that wrong. Also, check that the heater grids are properly installed: the strike plates, level indicators (typically nuclear), and vibrators you use for evacuating the hopper. We also have fluffing nitrogen connections above the knife gate valves that may help get catalyst moving. We have never used them, but they are there.
Regarding the operation, do not let catalyst accumulate in the hopper. Empty each hopper early and often; and when there is an upset, empty the hopper more often. You cannot do it enough. Pay attention to the sensory indicators. A good operator can tell if the hopper is empty or not if it is not rattling right. Utilize strike plates to hear the difference between the sound of an empty drum and a full one. Next, monitor those hopper temperatures; and then, do grid checks. These hopper heater grids have multiple patches. You can lose one patch and have a cold spot, so make sure you are checking each one of those grids on a regular interval: maybe quarterly. I think we do ours every six months. We check those grids to ensure they are working right before the winter hits, because they can short out. We have lost patches and been able to catch it that way. The bulk temperature of ESP inlet at 425°F or greater. If you are too aggressive on your sootblowing activities for your waste heat boiler, sometimes you will get that temperature a little too cold. The ESP does not perform well when the flue gas is too cold.
DINKEL [Marathon Petroleum Corporation (MPC)]
I agree with Darin’s points about making sure your hopper heaters are working and not allowing the hoppers to back up. I will add a strategy we use internally. One of the newer units is doing biannual PM (particulate matter) audits with the manufacturer coming in to perform a complete review of the ESP, including looking at all the cells and basically going through and tuning the cells to optimize performance. On an older unit that we just retired last year, we got to the point where we were doing quarterly audits on it to make sure we could maintain our environmental compliance.
FEDERSPIEL (W.R. Grace & Co.)
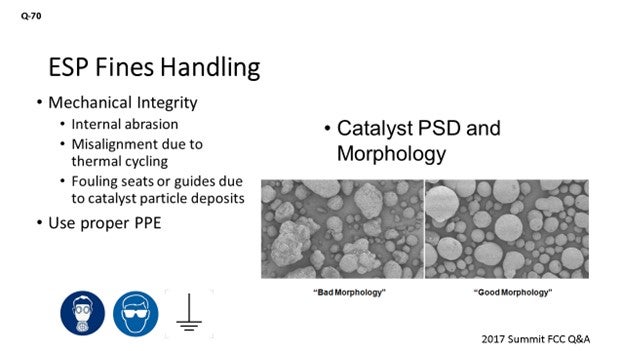
We looked at what could be complicating fines handling out of an ESP. We might be able to break that down into some mechanical integrity issues where it is possible that internal abrasion is impacting your ability to offload due to long-term operation. If the valve fittings were misaligned due to thermal cycling, or if catalyst particles fouled the seats of the valve guides, then that might also impact your ability to withdraw the catalyst. I think this is the first time the panelists are going to disagree. I get to say that catalyst PSD (particle size distribution) and morphology, I believe, do play a role in the ability to move those fines material out just by the fact that an irregularly shaped particle has a higher surface area. And because these are fines, you know the surface area-to-mass ratio is a little higher and gets a little more cohesive as we increase that surface area to mass ratio.
The last part of the question is about safe handling. Using proper PPE (personal protective equipment) is going to include goggles and a face mask. Also, make sure you are properly grounded before any operators to do anything with the ESP.
MICHAEL FEDERSPIEL (W.R. Grace & Co.)
Electrostatic precipitators (ESPs) represent an effective medium for particulate emissions control and are, therefore, commonly used within the FCC industry, especially in North America. Although ESPs are not designed to capture all of the catalyst particles present in the regenerator flue gas, they usually exhibit sufficient performance to successfully reduce the particulate content in the flue gas below 50 mg/Nm3. As the question suggests, fluidization and mechanical integrity issues can significantly hinder the withdrawal and handling activities of catalyst fines.
With respect to mechanical integrity, the most common issues correspond to malfunctioning catalyst discharge valves to the collection hoppers due to any of the following causes, among others:
The electrode and collection plate rappers can also experience mechanical integrity issues that can significantly hinder catalyst withdrawal efficiency. These mechanical rappers help maximize the recovery of the ESP fines while properly preserving electrode efficiency and performance throughout long-term operation. Complete failure, or suppressed performance of these rappers, generally reduces the number of fines withdrawn from the system at constant particulate loadings and can significantly shift the particle size distribution (PSD) of the withdrawn fines towards a coarser profile. The reduced capability of withdrawing fines is usually accompanied by gradual increases in particulate emissions at the stack beyond the normal or allowable ranges. The mechanical integrity of the rappers can be affected by thermal cycling over time, as well as fouling issues stemming from the ingress of fines.
Operating conditions also influence the mechanical integrity of the ESP. Sudden thermal cycles, such as those associated with an emergency trip of the unit or sudden bypass of the ESP train, can increase the threat of mechanical integrity deficiencies associated with buckling or thermal expansion. Electrical or pneumatic supply deficiencies have also been reported, although they can be mitigated through redundant supply systems and/or onsite spare parts for the critical components. These types of mechanical failures have generally exhibited frequencies of zero to five times per planned turnaround cycle. Other mechanical or electrical supply issues are also commonly reported, but these tend to impact ESP performance to a much greater extent than the capability of handling fines.
The morphology and PSD profiles of the ESP fines will have a strong impact on the fine's withdrawal efficiency. Cyclone performance within the regenerator plays a major role in ESP performance and the corresponding fluidization properties of the ESP fines. Healthy cyclone operation typically results in average particle sizes (APS) in the range of 15 to 30 microns, depending on the regenerator design and overall hydraulic profile. Adequate cyclone performance helps maintain a manageable particulate loading to the ESP while sustaining a healthy PSD profile for the ESP fines. Excessive loadings to the ESP, over an extended duration, can have the following impacts:
Excessive attrition within the reactor-regenerator system or the regenerator flue gas train can significantly reduce the APS of the fines, essentially increasing the concentration of microfines and fractured particles. These microfines and fractured particles tend to agglomerate, preventing smooth flow of the ESP fines into the collection hoppers. This type of fluidization issue is more prevalent once the APS of the fines drops below 15 microns. The jagged edges caused by catalyst fracturing can be identified by SEM analyses of the ESP fines samples. Even with a healthy PSD profile in the fines, agglomeration can occur due to other flue gas system failures, such as a flue gas cooler leak. The steam and boiler feed water in contact with catalyst fines can quickly lead to undesired catalyst agglomeration. Further, in extreme cases, acid dew point corrosion may be observed. These types of flue gas cooler leaks can be detected through sudden increases in the process-side pressure and much higher metals deposits on the ESP fines than those of the circulating e-cat inventory. The affected flue gas cooler tubes, or banks, should be isolated as quickly as possible to mitigate further erosion and downstream issues.
With respect to safe handling of the ESP fines, the industry Best Practices involve adequate use of PPE and easily accessible manifolds for the fines withdrawal system. In addition to the standard PPE requirements for refinery operations, fines handling activities should be accompanied by safety goggles, a respirator mask, and adequate equipment grounding facilities.
BRYAN DINKEL [Marathon Petroleum Corporation (MPC)]
Within the MPC system, we have only one operating unit with an ESP and we utilize gravity dumping into roll-off bins. This ESP is a relatively new piece of equipment that followed recommended design guidelines from the manufacturer. We do not have handling issues, as long as hopper heaters and vibrators are maintained. As a precaution, we have the equipment manufacturer conduct biannual field assessments to perform preventative maintenance (PM) and assurance that the equipment is functioning properly. During the design phase of a TSS (third-stage separator) project, MPC funded a hopper study that was completed by Jenike & Johanson. The goal was to optimize hopper selection and design angles based on their own analysis to determine physical properties of the catalyst fines. This strategy could be applied to ESP hoppers as well.
We recently retired a unit that had an old ESP which had design, maintenance, and operational deficiencies. That unit battled frequent issues with elevated opacity due to hoppers backing up. A hopper backing up poses multiple risks to the ESP performance, including being the cause of breaking wires, shorting out cells, and re-entraining fines into the flue gas flow path. A focused response was implemented to address these failures. We utilized quarterly preventative maintenance audits to resolve most of the issues. These audits included onsite electrical engineers, I&E (instrumentation and electrical) technicians, Operations and Maintenance personnel, and the equipment supplier. Key findings included the following:
DARIN FOOTE (CHS Inc.)
At CHS, we have dry ESPs on both of our operating units. Both utilize gravity dumping into contained roll-off bins.
Our experience is that catalyst fines content or morphology does not have a noticeable effect on whether or not ESP fines will dump from the hoppers. Catalyst that is allowed to accumulate in the hoppers can act as an insulator to the bulk temperature inside the ESP. As the accumulated catalyst piles up, the likelihood of condensation increases near the wall. Condensation is the most common cause of catalyst dumping problems. The following are important elements of design and operation that help ensure safe and reliable hopper evacuations.
Design
Operation
DINKEL [Marathon Petroleum Corporation (MPC)]
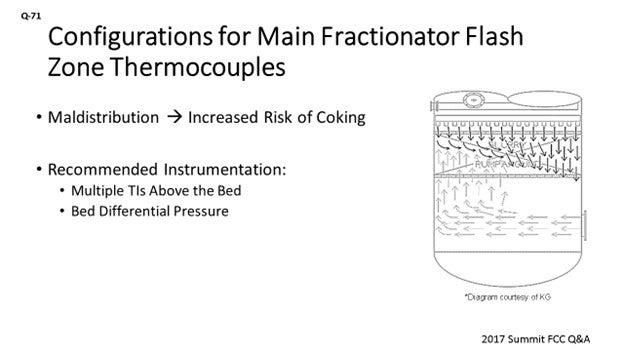
The diagram on the slide is an example of the bottom of a fractionator showing maldistribution that increases your risk of coking in the bottom of the tower. Within Marathon, our recommended location to put TIs (temperature indicators) is actually above that bed. We want to have somewhere between six and 12 Tis, which will allow you to get a radial profile of the temperature above the bed. We also like to couple that with a dP cell across the bed. It will not correct the maldistribution, but it will give you early indication and allow you to make some corrective moves.
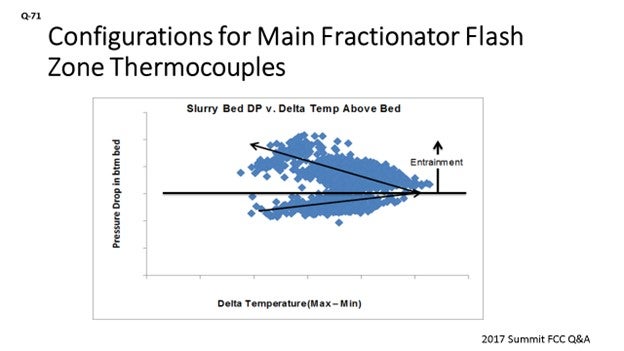
This slide is an example of data from one of our units. It has seven TIs above the bed. The X axis is defined as the delta temperature; that is, the highest minus the lowest to give an indication of the temperature spread. On the Y axis is the pressure differential. This is showing that as the pumparound rate increases, that dP is going up. The spread widens. It is going towards the right; and then at the inflection point, the spread looks like it actually gets better. We were then able to identify an undersized distributor. We were re-entraining a lot of that liquid from the distributor above the bed. It actually made the distribution above the bed look better, but it was not helping us, in terms of the actual packed bed itself. So, we used that data from the Tis and dP to troubleshoot and identify an opportunity for the next turnaround when we would go in to do a redesign and address that undersized distributor.
MALLER (TechnipFMC Process Technology)
In addition to the thermocouples above the bed, a TechnipFMC practice is to put three thermocouples in the flash zone just below the bottom of the bed. These thermocouples are spaced apart to 120°F and provided with a shroud to shield them from the liquid raining down from above. From a design perspective, we target a maximum flash zone temperature of 740°F. However, it is important to remember that this section of the tower is not at equilibrium. Temperature measurements in this area could be misleading and may not provide any actionable information. However, they may be useful for trending long-term patterns. For additional information, we also provide typical skin temperature measurements inside the bed elevation to get some indication of maldistribution.
BRYAN DINKEL [Marathon Petroleum Corporation (MPC)]
It is important to measure the main fractionator flash zone temperature in the proper location such that it provides meaningful information. Temperature indicators (TIs) located below the slurry bed are at risk of coking, subject to maldistribution of vapor entering the tower, and are at a location before the vapors have been de-superheated. The figure shown below illustrates vapor maldistribution entering the bottom of the tower and the impact on liquid distribution.
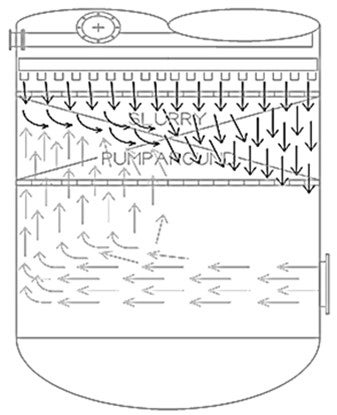
Figure 71-1. Main Fractionator Bottoms, Vapor Distribution Example37
I am familiar with a unit that was monitoring its temperature below the slurry internals and did not realize that the flash zone temperature was high. The shed baffles in this unit coked up, contributing to higher tower dP and placing more solids into the bottom of the tower, which resulted in more frequent pump screen cleanings and accelerated fouling of exchangers.
Within MPC, our recommended location to install TIs is above the bed. We recommend that multiple thermocouples be used to provide a radial temperature distribution that can be monitored to determine maldistribution when coupled with a reliable pressure differential (dP) instrument. This quantity could be between six and 12 thermocouples, depending on the vessel diameter. The instrumentation does not resolve a maldistribution problem, but it does provide an early indication to allow for corrective steps to be taken (e.g., if pumparound liquid flow is too low for distributor design).
The next chart illustrates the use of the recommended instrumentation to evaluate performance. This example is from a unit that has seven temperature indications above the slurry grid and a dP instrument. The chart shows the relationship of the slurry grid dP versus the temperature spread above the grid, as defined as maximum temperature minus the minimum temperature. The relationship observed is that the temperature spread degrades and then improves above a certain dP, which is directly correlated back to the liquid loading from the pumparound. Ultimately, the relationship shows what happens when liquid entrainment increases due to an undersized distributor. This identified issue was flagged for correcting the distributor design during the next turnaround.
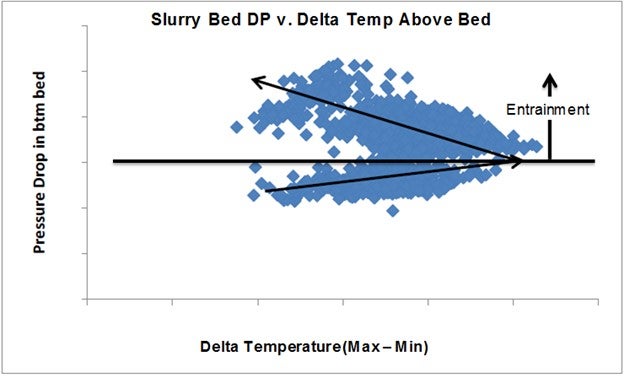
Figure 71-1. Slurry Grid DP versus Temperature Distribution
ALEX MALLER (TechnipFMC Process Technology)
The main fractionator flash zone is an area in the tower where superheated reactor vapors enter and are quenched by the liquid raining down from the bottom tray. It is important to have good vapor/liquid contacting to prevent channeling of hot vapors that can lead to coking in the packing or baffles above. Vapor distributors are typically avoided or made to be extremely simple for this service as they are prone to coking. The only indication of maldistribution of the vapors is the thermocouples applied in this area. Our practice is to use three thermowells, spaced 120 degrees apart and located just below the bottom packing bed. They are provided with a shroud to shield them from liquid falling from the packing above such that the measurement is only the vapor temperature. For design, we typically target a maximum flash zone temperature of 740°F (393°C). However, it is important to recognize that the main fractionator flash zone is an area that is not at equilibrium. Measuring a temperature at a single point or at multiple points may not give very meaningful or actionable information, but it can be useful for trending purposes. Also keep in mind that this area of the tower is rather severe, and it is not unusual for these types of readings to become unreliable. For additional information on the distribution of vapors inside the bottom bed, skin thermocouples can be utilized.
DINKEL [Marathon Petroleum Corporation (MPC)]
This question is about slurry fouling, as well as minimizing slurry. The table on the left is a summary of key parameters we watch for slurry fouling, including monitoring minimum velocities in both the piping circuit and heat exchangers. We track heat exchanger fouling, whether that is heat transfer coefficients, if the instrumentation is in place, or by completing pressure surveys to keep an eye on pressure differential across the exchangers. We also monitor the physical properties of the slurry.
In 2014, we did a slurry study with Baker Hughes. We sent in samples from each of our units, and they were put through a battery of tests. This is shown in the middle column under the header of TAR (total adherent residue) number. It is a Baker Hughes fouling potential number, and it is actually derived from multiple analyses that feed into determining this fouling potential. Most people talk about slurry gravity results and risk of fouling the circuit. The key takeaway here is that if you rank by the TAR number versus individual analysis results, there are different risk ranking orders. You can see that the second highest risk unit we have actually has zero gravity and would have been ranked as the lowest risk. So, the takeaway here is that you cannot rely on just one piece of information. You need to be looking at multiple analyses in the system.

On the next slide, I show an example from one of our units that has done this evaluation of multiple pieces of data. Over about a six-month period of time, this unit was using its APC (advanced process control) to slowly step down the slurry gravity by collecting data multiple times during the week and doing a cross-plot of the viscosity versus the gravity. You can see that as you step down on this slurry gravity, you reach a point where that viscosity takes off exponentially. Coupled with this slurry property data, the unit is also monitoring fouling indications and heat transfer coefficient and using that data together to select the optimum operating point on the unit.
The next slide covers the part of the question about some of the options you have to address. One option is rather expensive: dropping LCO down to slurry. It will increase your flow rates in the system, as well as downgrade LCO to slurry, which is a less valuable product. We had some success using a fouling additive to extend run-lengths on exchangers. If you have parallel exchangers, a sparing strategy is another option to use if you are low on velocity and can afford to take out one of those parallel exchangers. You can increase velocity. Last is the rundown recycle loop, which is setting up a recycle loop all the way to tankage and back to the unit. We have looked at this in detail in one unit. Ultimately, we did not end up pursuing it just because of the distance of the tankage from the unit. You are talking about quite a bit of pipe insulation and heat tracing. This option may possibly also require a new pump or exchanger to keep the material hot and prevent it from setting up.
FOOTE (CHS Inc.)
I will just go through a couple of the limits we have seen associated with minimizing slurry. One is when we did see some polymerization in one of our units of our main column bottoms. It showed up as a rapid exponential loss in flow and heat exchange; and when they pulled off the dollar plates of the main column steam generator, they just saw little shiny black plugs in the first inlet pass. They went about two inches down the tube sheet. We pulled them out and were then able to start back up. That unit now has a limit of about 650°F on the main column bottoms, which impacts the slurry make. We have also seen instability in the HCO pumparound circuits. So, here, as the liquid flows below light cycle draw and goes way down, you will be minimizing that slurry make. Sometimes that heavy cycle oil section becomes unstable, either through leaking or maldistribution of your return liquid. We have had upsets where we lost that pumparound and had it upset a debutanizer as a result. So, you have to drop LCO down and re-inventory that section.
One solution there is to have a total draw on the LCO, which can be the most expensive option. The next most expensive option is V-notch weirs with level control (a poor man’s total draw tray design). Picket-fence weirs can be your last solution, just to improve distribution in the fractionator to make sure you maintain like 3 gpm (gallons per minute) per inch on your weir loading. We also saw the PNA cycle up the ‘red death’. So, know what that looks like when you start going to that mode and know when you are getting into that situation.
FEDERSPIEL (W.R. Grace & Co.)
Aside from the very clear impact a catalyst has on slurry yield, it can also play a role in tray fouling minimization by ensuring that you have converted enough of the naphthene aromatics out of the slurry to avoid further contributing to fouling in the bottom circuit. So, if you want to avoid having to downgrade LCO to the slurry, ensure that your maximum conversion of the available slurry molecules – and particularly the naphthene aromatics – will impact the solubility of the PNAs. Lastly, of course, as you are going through the exercise of minimizing slurry or maintaining sufficient flow-out, you will cycle up the catalyst in the bottom circuit, which will be important to monitor for any erosion of the slurry circuit.
MELVIN LARSON (KBC Advanced Technologies, Inc.)
With regard to the tower you mentioned, if the unit has an HCO pumparound where HCO is the first side-draw from the bottom of the column, then KBC advises having a hot pump-back reflux system. By taking hot HCO draw and pumping a portion directly below the draw tray, the unit is assured of having internal reflux at a critical location in the tower. KBC has seen a number of units operate dry in this section of the tower, which has resulted in poor fractionation.
BOB LUDOLPH [Shell Global Solutions (US) Inc.]
When it comes to fouling, I will add that we have considered slurry residence time in the past; that is, looking at how much time the slurry product spends in the bottoms circuit, including the circulating lines. The dependence of fouling on residence time was not strong but, nonetheless, was found to be a contributor for any given bottoms temperature being maintained. So, it may be worth considering for your unit.
BRYAN DINKEL [Marathon Petroleum Corporation (MPC)]
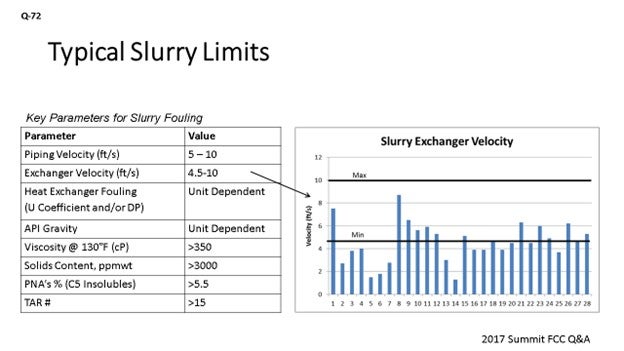
It is fair to say that past, current, and future economics will almost always call for the minimization of slurry production. As slurry production is minimized, the risk increases to foul exchangers or plug lines due to low velocities. Additionally, as slurry is minimized, the quality of the slurry will degrade, which will also increase the risk of fouling. The following table summarizes key monitoring points. Some are easier to track on a regular basis at refinery labs rather than sending them to an outside lab.
Table 72-1. Key Parameters for Slurry Fouling
|
PARAMETER |
VALUE |
|
Piping Velocity, fps (feet per second) |
5-10 |
|
Exchanger Velocity, fps |
4.5-10 |
|
Heat Exchanger Fouling (U Coefficient and/or dP |
unit-dependent |
|
API Gravity |
unit-dependent |
|
Viscosity @ 130°F [cP (centipoise)] |
>350 |
|
Solids Content, ppmw |
>3,000 |
|
PNAs % (C5 Insolubles) |
>5.5 |
|
TAR # |
>15 |
As an example of the recommended velocity windows, the following figure summarizes average heat exchanger velocities and where they fit in relation to the recommended limits. The limits are established based on minimizing fouling and settling at low velocities and erosion at higher velocities. There are several exchangers that are well below the recommended 4.5 fps minimum, and which do not have accelerated fouling issues, primarily because they are on units with a sufficient amount of LCO content to inhibit fouling, or because they are on exchangers late in the train and have lower inlet temperatures. Additionally, some of them have parallel exchangers that allow for online cleaning when needed.
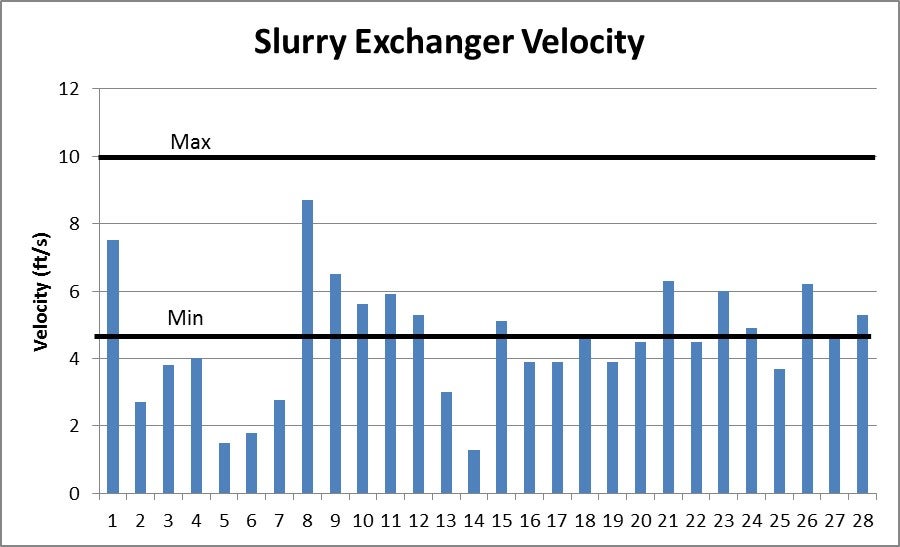
Figure 72-1. Slurry Exchanger Tube Velocities versus Recommended Range
We have determined that no one physical property is a good indicator of fouling risk when comparing units, which is due to the differences in feed quality and operating conditions of each unit. The table below summarizes data produced by Baker Hughes for a 2014 study of our eight units at the time. The results of this study show relative ranking of slurry circuit fouling potential. The TAR# is the most telling analysis from Baker Hughes’ review of the unit slurry properties which accounts for multiple analyses into an index. You can see that the ranking of TAR# does not produce the same ranking order as the individual Stability Index (SI), polynuclear aromatics (PNA) content, viscosity, or API gravity.
Table 72-2. 2014 Slurry Fouling Study by Baker Hughes
|
|
API Gravity (°) |
Viscosity (cP) @ 130°F |
Solids ppm |
Coke % |
Catalyst % |
TAR #1 |
SI2 |
PNA % |
Bottoms T (°F) |
|
A |
-0.2 |
95 |
2,435 |
5 |
95 |
10 |
118.1 |
1.9 |
650 |
|
B |
-0.9 |
139 |
1,287 |
5 |
95 |
12.1 |
112.0 |
4 |
680 |
|
C |
-0.8 |
130 |
476 |
6 |
94 |
12.4 |
132.8 |
5.1 |
660 |
|
D |
0 |
400 |
1,010 |
10 |
90 |
19.9 |
124.8 |
6.9 |
690 |
|
E |
-1 |
229 |
493 |
9 |
91 |
21.6 |
123.1 |
9 |
685 |
|
F |
-3.3 |
386 |
3,232 |
39 |
61 |
40.6 |
48.4 |
13.9 |
655 |
|
G |
0 |
278 |
8,665 |
86 |
14 |
51.6 |
19.8 |
11.7 |
670 |
|
H |
-1.4 |
564 |
26,973 |
98 |
2 |
115 |
10.2 |
15.8 |
670 |
Table Notes:
TAR# is defined as a measure of fouling potential based on correlations between refinery fouling and slurry analysis data.
Stability Index (SI) is defined as a polynuclear aromatics (PNA) stability test which determines the point of PNAs becoming unstable and precipitating out of the sample.
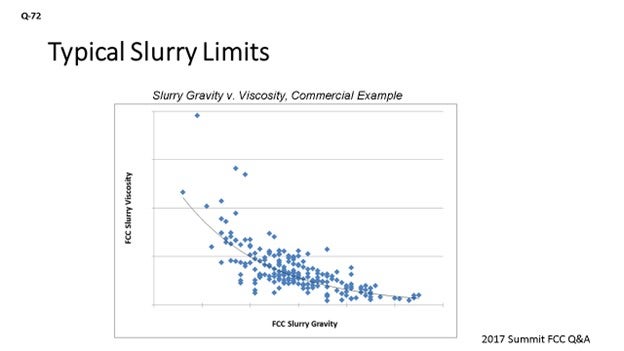
We recommend that units empirically determine their optimum operating point by conducting step tests on a regular frequency, particularly when feed or operating conditions change drastically. We have a couple of units that are fully utilizing their advanced controls to help drive this on a consistent basis. Figure 72-2 illustrates results from a step test conducted on one of our units. This test shows the relationship for their unit between API gravity and viscosity. The other piece of information required to tie into the evaluation was the monitoring of slurry exchanger fouling. Utilizing this curve and an economic assessment of fouling impact versus LCO recovery determined the optimum operating point.
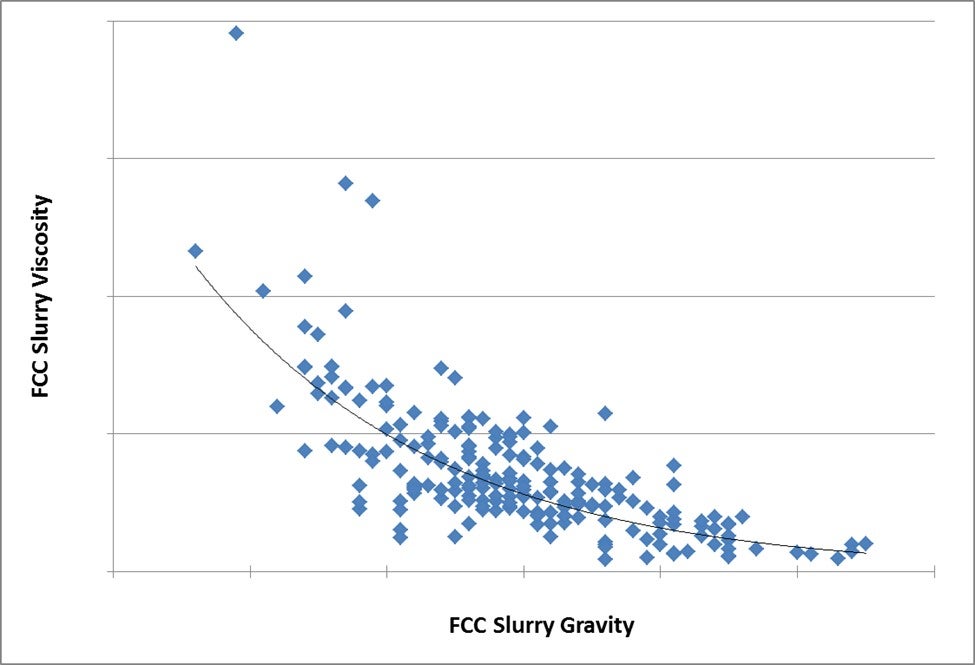
Figure 72-2. Slurry Gravity versus Viscosity: Commercial Example
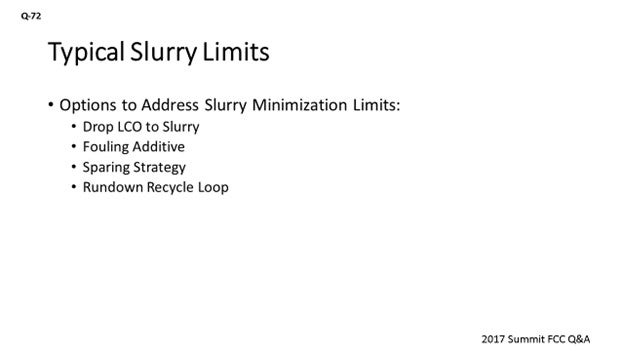
Apart from downgrading LCO to slurry pool to maintain velocities and/or properties, these are a few options we have implemented or considered to address fouling in slurry circuits:
Fouling Additive: We have one unit that trialed an additive which doubled the run-length between required exchanger cleanings.
Sparing Strategy: If multiple exchangers operate in parallel and the velocity is too low, you can evaluate the system hydraulics and tube velocities to determine if one or more exchangers can be removed from service and placed in standby. We have multiple units that have successfully implemented this strategy as part of their exchanger fouling solutions minimization strategy. Refer to 2014 Cat Cracker, Question 12 regarding discussion on setting exchangers in standby. It was a lengthy question. Herb Telidetzki (Tesoro Corporation) provided a response about placing exchangers on standby.
Rundown Recycle Loop: We studied the option of installing a rundown recycle loop back from tankage to the unit battery limits on one unit and plan to review the same option on a couple of our other units. For this particular FCC, the distance of the product tank from the unit was cost-prohibitive with regard to required piping, insulation, heat-treating, and heater requirements.
MICHAEL FEDERSPIEL (W.R. Grace & Co.)
The current economic landscape favors slurry minimization if it can be properly upgraded to liquid products. Optimized FCC units generally operate in a delicate balance between LCO maximization and slurry circuit fouling. Slurry circuit fouling is primarily dependent on temperature, residence time, and composition of the slurry product within the system. From a design perspective, minimizing the residence times within the slurry circuit should be a critical focus to help establish enhanced slurry minimization flexibility. Most of the residence time within the system – defined as overall slurry circuit volume divided by the net slurry product rate – will correspond to the liquid volume within the column. Therefore, the main column diameter and slurry pump NPSH (net positive suction head) requirements should be properly optimized to minimize the liquid level requirements within the column. All heat exchanger manifolds, and key slurry circuit equipment should also exhibit as compact of a plot area as possible, while preserving adequate maintenance accessibility to the key equipment. Maximizing the amount of spare or redundant exchangers along the slurry circuit can also help further push the envelope of slurry minimization by enabling prompt onsite cleaning of fouled exchangers without hindering unit throughput or conversion severity.
With respect to mitigating slurry circuit fouling, industry Best Practices recommend adhering to the following set of process conditions and regimes:
Slurry product gravities lighter than -2 to -5°API,
Slurry viscosities lower than 25 cSt (centistokes) at 212°F,
Main column bottom temperatures below than 680 to 700°F,
Heptane insoluble content below 2 wt%,
Slurry piping and exchanger velocities between 4 and 10 fps,
Reactor vapor line velocities higher than 100 fps, and/or
Minimum allowable main column bottoms level while providing sufficient response times and operating flexibility in the event of an emergency.
The referenced guidelines are general and will be largely dependent on the FCC feedstock properties. Paraffinic feedstocks tend to yield less thermally stable slurry products, thus enhancing the importance of the residence time and temperature profiles. Alternatively, heavy aromatic feedstocks tend to yield more thermally stable bottoms products that provide slightly greater operating flexibility along the limits of the cited process regimes. The use of a slurry quench can help push the composition limits while complying with the temperature limitations. However, it should be noted that this approach sub-cools the slurry product within the column, thus enhancing the importance of slurry composition monitoring via lab data or bubble point monitoring.
A side stripper for the slurry product can significantly expand the slurry minimization flexibility by mitigating slurry fouling hazards. This design configuration helps drop more of the LCO material towards the slurry cut within the column since most of the LCO components can be recovered through the downstream side stripper. This approach helps lower the composition and temperature of the bottoms liquid level, which typically represents a large majority of the residence time within the overall slurry system. From a piping and exchanger velocity standpoint, additional flexibility can be obtained by installing a spillback loop from the slurry rundown line to the net slurry product train inlet. This type of spillback can help sustain exchanger velocities higher than 4 fps throughout periods of deep bottoms conversion or during turndown operation.
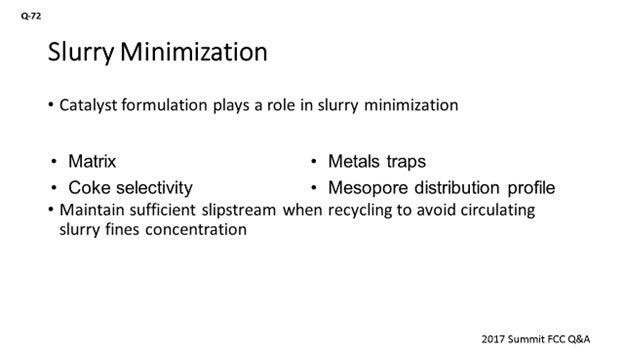
The catalyst formulation also plays a significant role in the overall slurry minimization strategy. Sufficient matrix area should be provided to properly upgrade the bottoms product catalytically rather than thermally. Further conversion selectivity can be pursued through coke-selective catalyst options that employ strategic metal traps and mesopore distribution profiles. Some units operating with light or highly-crackable feedstocks have pursued cracking the slurry towards extinction through a combination of catalyst formulation, reactor severity, slurry circuit fouling mitigation, and slurry recycles to the riser. When operating in deep bottoms-upgrading regimes, it becomes critical to maintain a slipstream at all times to properly flush the catalyst fines out of the system. Failure to do so can lead to excessive fines concentrations in the circulating slurry, resulting in suppressed exchanger duties and accelerated erosion within the system.
DARIN FOOTE (CHS Inc.)
At CHS, we operate two units with highly hydrotreated feed. One operates in full-burn operation, and the other operates in partial-burn. The full-burn unit utilizes slurry recycle to maintain regenerator temperature high enough meet CO emissions. In this unit, we recycle slurry to near extinction. We have not encountered any cycling up of fines in the slurry circuit. In systems where both cyclones are healthy, the slurry fines are pushed to the regenerator via the slurry recycle loop. Table 1 lists a few of the limits we have encountered when trying to minimize slurry make.
Table 1: Limits Encountered While Minimizing Slurry Make
|
LIMIT |
PROBLEMS |
OPTIONS TO OVERCOME |
|
Polymerization of Slurry in the Bottoms Exchange |
This limit appears to be feed dependent. Both of our units run similar feed sulfur/nitrogen, but only one of them has experienced polymerization. It shows up as an exponential loss of heat exchange and flow in the MCB circuits. |
Monitor slurry viscosity regularly for marked increase from baseline. In this particular unit, we typically run 650°F or less in the MC bottoms to avoid this condition, which impacts slurry fractionation. Reducing operating level in the MCB can also reduce residence time. |
|
HCO PA Circuit |
During periods of low slurry make, the liquid flow from the LCO draw is unstable. This instability has caused us to lose the HCO PA (debutanizer reboiler) for a period of time until we can cut the LCO draw sufficiently to wet the HCO section and reestablish PA flow. |
Fractionator design: Consider a total draw with a pump-back to maintain wetting of the HCO section. If a total draw is not possible, consider picket fence weirs below the LCO draw to improve distribution. As a general design standard, we use 3 gpm/inch as a minimum weir loading. |
|
Rundown Velocity/Volume |
In our unit where we use slurry recycle, we have to set limits on recycle to ensure we maintain flow to storage and sufficient exchanger velocity. We have set the minimum slurry to storage limit at 1 to 1.5%vol. |
Bring a MCB quench/recycle line back from slurry tankage. This practice will increase traffic in the rundown line and allow the unit to recycle slurry to extinction when feed quality allows. The long-term slurry recycle rate can be set by tank level. |
|
SIS Isolation of Recycle Slurry to the Riser |
In our unit where we recycle slurry back to the riser, we have had problems achieving a tight shutoff for our SIL-rated isolation valve towards the end-of-run. In one instance, we leaked slurry by the valve to the riser after hydrocarbon was diverted, which caused a temperature excursion in the regenerator on initial circulation with steam. |
Valve design/redundancy |
|
Polynuclear Aromatics (PNAs) Cycling Up When Sending FCC Slurry to the Coker |
At one of our sites, we have seen PNAs cycle up when sending slurry to the coker. The PNAs cycled up in the HCGO and impacted catalyst life in the GOHT. At its peak, it manifested as a red color in the hydrotreated gasoil. |
Monitor the hydrotreater operation. |