Question 71: What are your recommended configurations for main fractionator flash zone thermocouples to measure the flash zone temperature under the slurry bed?
DINKEL [Marathon Petroleum Corporation (MPC)]
The diagram on the slide is an example of the bottom of a fractionator showing maldistribution that increases your risk of coking in the bottom of the tower. Within Marathon, our recommended location to put TIs (temperature indicators) is actually above that bed. We want to have somewhere between six and 12 Tis, which will allow you to get a radial profile of the temperature above the bed. We also like to couple that with a dP cell across the bed. It will not correct the maldistribution, but it will give you early indication and allow you to make some corrective moves.

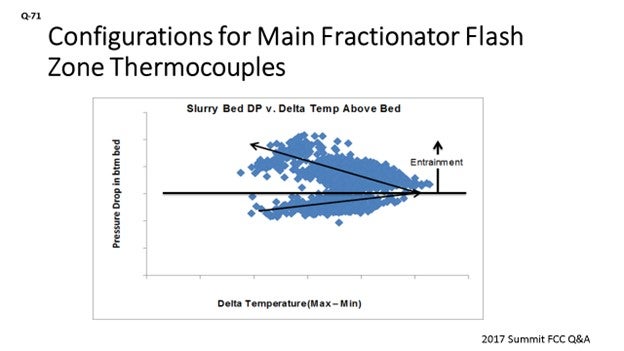
This slide is an example of data from one of our units. It has seven TIs above the bed. The X axis is defined as the delta temperature; that is, the highest minus the lowest to give an indication of the temperature spread. On the Y axis is the pressure differential. This is showing that as the pumparound rate increases, that dP is going up. The spread widens. It is going towards the right; and then at the inflection point, the spread looks like it actually gets better. We were then able to identify an undersized distributor. We were re-entraining a lot of that liquid from the distributor above the bed. It actually made the distribution above the bed look better, but it was not helping us, in terms of the actual packed bed itself. So, we used that data from the Tis and dP to troubleshoot and identify an opportunity for the next turnaround when we would go in to do a redesign and address that undersized distributor.
MALLER (TechnipFMC Process Technology)
In addition to the thermocouples above the bed, a TechnipFMC practice is to put three thermocouples in the flash zone just below the bottom of the bed. These thermocouples are spaced apart to 120°F and provided with a shroud to shield them from the liquid raining down from above. From a design perspective, we target a maximum flash zone temperature of 740°F. However, it is important to remember that this section of the tower is not at equilibrium. Temperature measurements in this area could be misleading and may not provide any actionable information. However, they may be useful for trending long-term patterns. For additional information, we also provide typical skin temperature measurements inside the bed elevation to get some indication of maldistribution.
BRYAN DINKEL [Marathon Petroleum Corporation (MPC)]
It is important to measure the main fractionator flash zone temperature in the proper location such that it provides meaningful information. Temperature indicators (TIs) located below the slurry bed are at risk of coking, subject to maldistribution of vapor entering the tower, and are at a location before the vapors have been de-superheated. The figure shown below illustrates vapor maldistribution entering the bottom of the tower and the impact on liquid distribution.
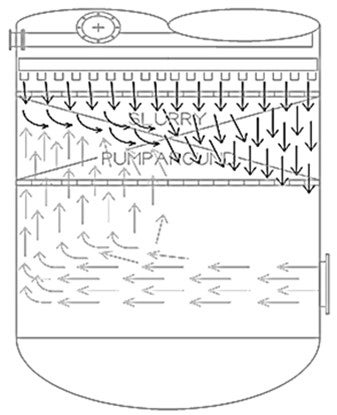
Figure 71-1. Main Fractionator Bottoms, Vapor Distribution Example37
I am familiar with a unit that was monitoring its temperature below the slurry internals and did not realize that the flash zone temperature was high. The shed baffles in this unit coked up, contributing to higher tower dP and placing more solids into the bottom of the tower, which resulted in more frequent pump screen cleanings and accelerated fouling of exchangers.
Within MPC, our recommended location to install TIs is above the bed. We recommend that multiple thermocouples be used to provide a radial temperature distribution that can be monitored to determine maldistribution when coupled with a reliable pressure differential (dP) instrument. This quantity could be between six and 12 thermocouples, depending on the vessel diameter. The instrumentation does not resolve a maldistribution problem, but it does provide an early indication to allow for corrective steps to be taken (e.g., if pumparound liquid flow is too low for distributor design).
The next chart illustrates the use of the recommended instrumentation to evaluate performance. This example is from a unit that has seven temperature indications above the slurry grid and a dP instrument. The chart shows the relationship of the slurry grid dP versus the temperature spread above the grid, as defined as maximum temperature minus the minimum temperature. The relationship observed is that the temperature spread degrades and then improves above a certain dP, which is directly correlated back to the liquid loading from the pumparound. Ultimately, the relationship shows what happens when liquid entrainment increases due to an undersized distributor. This identified issue was flagged for correcting the distributor design during the next turnaround.
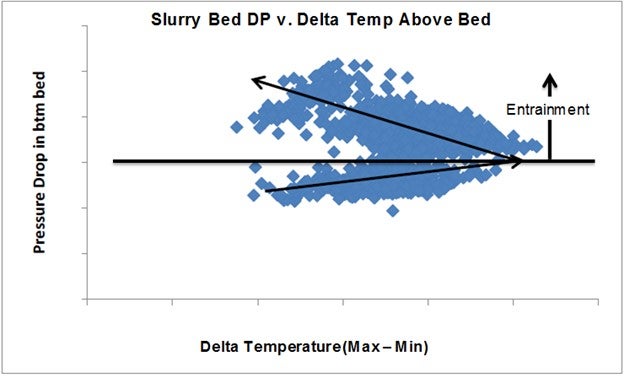
Figure 71-1. Slurry Grid DP versus Temperature Distribution
ALEX MALLER (TechnipFMC Process Technology)
The main fractionator flash zone is an area in the tower where superheated reactor vapors enter and are quenched by the liquid raining down from the bottom tray. It is important to have good vapor/liquid contacting to prevent channeling of hot vapors that can lead to coking in the packing or baffles above. Vapor distributors are typically avoided or made to be extremely simple for this service as they are prone to coking. The only indication of maldistribution of the vapors is the thermocouples applied in this area. Our practice is to use three thermowells, spaced 120 degrees apart and located just below the bottom packing bed. They are provided with a shroud to shield them from liquid falling from the packing above such that the measurement is only the vapor temperature. For design, we typically target a maximum flash zone temperature of 740°F (393°C). However, it is important to recognize that the main fractionator flash zone is an area that is not at equilibrium. Measuring a temperature at a single point or at multiple points may not give very meaningful or actionable information, but it can be useful for trending purposes. Also keep in mind that this area of the tower is rather severe, and it is not unusual for these types of readings to become unreliable. For additional information on the distribution of vapors inside the bottom bed, skin thermocouples can be utilized.