Question 59: What challenges have you faced from processing crudes that contain elevated levels of wax crystal modifiers or flow improver chemicals?
DION (GE Water & Process Technologies)
This is a complex question. There are many different chemical families that can be employed as either wax crystal modifiers or flow improvers. Flow improvers can be dragging reducers or pour point depressants. I recommend empirically measuring its impact. For instance, if the concern is the additives’ impact on desalter operations, then the additive can be easily tested in a laboratory desalter simulator. The emulsification tendency of the crude can be measured with and without the additive. All specialty chemical suppliers should have desalter simulators, most of which are portable. The testing can be conducted in the refinery’s laboratory, if desired.
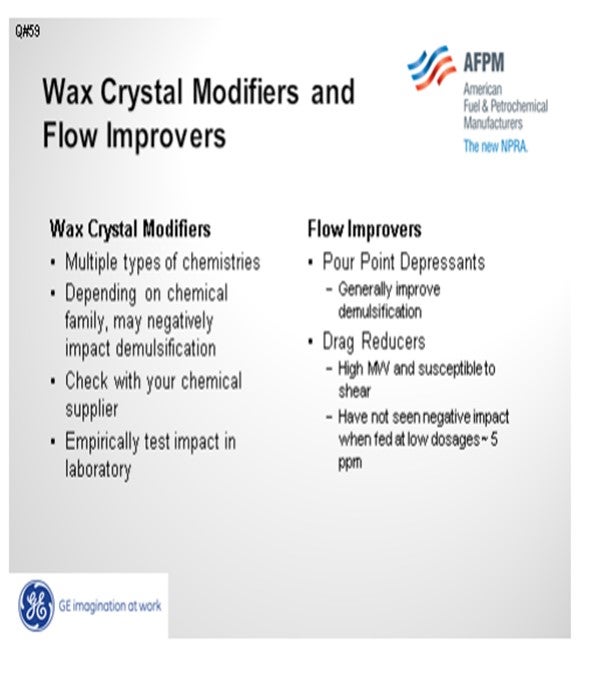
In general, the most common types of pour point depressants will be complementary or synergistic to demulsification. There are too many different chemical families that can be employed to make a general statement about whether wax crystal modifiers are synergistic or antagonistic to demulsification. It can be empirically determined. Drag reducers are very high molecular weight molecules. They are sensitive to shear and break into smaller molecules when they pass through pumps. The larger molecules that are not sheared should act similar to an asphaltene. In one refinery, we saw a situation where a drag reducer was overfed. The excess drag reducer precipitated in their raw crude tanks. When the tank was opened for corrosion inspection, they found a five- or six-inch thick deposit of an elastic, sticky material that had to be cut with shovels to get it out of the tank.
DION (GE Water & Process Technologies)
Wax crystal modifiers are typically amine oxides, amides or sulfonates. They are utilized to keep paraffins dispersed and reduce wax deposition. Flow improvers generally fall into two categories; pour point depressants and drag reducers. They are typically stearates, vinyl acetate copolymers, polyacrylates or polymeric alpha olefins. Pour point depressants typically promote the formation of compact, three dimensional crystals as the crude oil cools. The compact crystals decrease the pour point of the oil and improve low temperature flow properties. Flow improver chemicals are typically extremely large molecular weight materials. Like asphaltenes, they can precipitate to an oil/water interface and stabilize emulsions. There have been no noticeable desalter performance issues at dose rates of approximately 5 ppm. When dose rates are roughly 15 ppm to 25 ppm, desalter upsets may occur. In at least one refinery, a six inch layer of sticky elastic, caulk-like material has been observed on the bottom of the tanks and believed to be due to flow improver chemicals. In general, pour point depressants can improve emulsion resolution, while on the other hand paraffin inhibitors may have a deleterious effect. The exact effect would require either more specific information on the chemistry or empirical testing results.
BASHAM (Marathon Petroleum Corporation)
We have run crudes with flow improver at Marathon Petroleum Company’s Catlettsburg refinery for four to five years now with no known issues on our crude units.
DENNIS HAYNES (Nalco Energy Services)
In the past, there were some types of these chemistries in oil production that were reported to have problems on oil-water separation in desalting at the refinery; however, in recent history, improvements seem to have been made, and the products we have been asked to review for other companies have not shown adverse impacts regarding emulsification. If there is an indication that a new product is being used, evaluation on downstream impacts is recommended.
SAM LORDO (Nalco Energy Services) There have been a few reports of impacts on the amps/volts from crudes treated with pour point depressants. The impact was minor but noticeable in that additional power-draw was observable.
Year
2012
Process
Question 101: What analytical methods can distinguish between organic and inorganic iron (Fe) compounds in the feed? What type of iron, organic or inorganic, affects catalyst performance? Considering the relatively long reaction residence time of most laboratory test units used to measure activity, will activity testing properly reflect the actual in-FCCU activity under conditions of Fe contamination? What is your best method to monitor the catalyst performance under Fe contamination? Is ther
Dwight Agnello-Dean (BP)
We have not routinely attempted to identify the organic and inorganic iron components in our feeds. An internal expert suggested two approaches. First to determine the organic iron using ICP-OES, then wash the same sample with DI water, or slightly acidified water, and utilizing atomic absorption, determine the inorganic iron. The second approach is to determine total iron utilizing X-Ray, ICP or Atomic Absorption. Following this step remove the solids and water soluble, which would contain the inorganic iron, and rerun the hydrocarbon sample to determine the organic iron. The difference between total iron and organic iron is the inorganic iron.
As far as which form of iron affects catalyst performance, we follow the general consensus that organic iron is the issue and of primary interest. Over the last decade we have experienced catalyst performance issues that were correlated with elevated iron on the catalyst. During these events, ecat testing did not indicate an appropriate drop-in catalyst activity, which supports the questioner’s point that ecat program test methods are not adequate for this purpose. The symptoms we do look for are loss in bottoms upgrading (higher DCO yields), a drop in catalyst bulk density (ABD), a change in fluidization properties, potential circulation issues, and of course elevated iron on ecat. Across our units we don’t have a single critical iron level where we would expect problems because we consider this to be impacted by both the catalyst and the feedstock. Therefore, our current practices are to monitor our normal iron on ecat level and begin looking for other symptoms if we see the iron increase 0.3 wt.% over normal. For the units I am most closely associated with I expect to stay below 0.8 wt% iron. These units process very clean VGO feeds.
Ray Fletcher (Intercat)
Testing methods for feed stock analyses may be found in ASTM D7691 - 11 which include standard test methods for multi-element analysis of crude oils using inductively coupled plasma atomic emission spectrometry (ICP-AES). We believe that the high-performance liquid chromatography ICP-AES may be better at distinguishing organic and inorganic metal species.
It is widely accepted that organic iron in porphyries and naphthenates negatively affect the catalytic performance more than does inorganic iron.
The primary reason for the different performance effects between organic and inorganic iron is related to the size of these molecules. It is believed that small inorganic iron species are able to penetrate into the catalyst particle in most cases and disperse easily. On the other hand, large organic iron bearing molecules are typically sterically hindered and thus are unable to penetrate within the FCC catalyst particle. These molecules tend to deposit on the particle surface forming a barrier to diffusion. These iron rich layers are often several microns thick having a very rough nodular structure.
Our R&D team has found that the ECAT surface contaminated by organic iron contains a very dense amorphous iron rich layer which seals the macro, meso and micro-pores of catalyst. There is no penetration and reaction found at the interface between the iron layer and catalyst. The outer surface of an iron poisoned catalyst particle consists of a dense amorphous aluminosilicate phase with polycrystalline magnetite (Fe3O4) nanoparticles on top.
Most laboratory deactivation and testing methodologies used today are unable to accurately predict the effect of iron poisoning in a commercial unit. FCC catalyst suppliers have been active in developing special deactivation conditions to enable more accurate prediction capability with iron poisoning. None of these deactivation procedures have yet been able to accurately model an iron contaminated unit. The one test unit which may be capable of distinguishing iron effects is the circulating pilot plant. However, due to the sample sizes involved and the time & cost commitments few refiners have been willing to carry out extensive testing with this equipment.
The best method for monitoring iron poisoning is systematic and detailed unit monitoring. The focus is on "add-on iron". Most FCC catalysts contain 0.2-0.4 wt% iron depending upon the kaolin content and source. The add-on iron is the equilibrium iron less the fresh iron. Most catalyst systems are capable of handling +0.3 wt% add-on iron before negative effects are observed. Catalysts with alumina-based binding systems are usually capable of absorbing higher levels of iron at approximately 0.4-0.5 wt%.
The actual amount of iron the equilibrium catalyst is capable of absorbing without negative impact is directly related to the concentration of all contaminant metals including: nickel, vanadium, sodium, calcium plus iron. Most catalyst systems begin to observe negative effects when the total metal levels exceed 13,000 to 15,000 ppm. There are a few FCC units which regularly defy this rule of thumb having iron levels exceeding one wt%. These units are believed to be exceptions rather than the rule.
Iron nodules have been observed on the surface of equilibrium catalysts which have undergone high levels of iron contamination. The net result of these nodules has been poor blockage with a corresponding loss in bottoms conversion plus an apparent drop in ABD due to altered packing efficiencies. Many times, in spite of a lower ABD the fluidization characteristics of the unit have deteriorated. Additionally, as stated in question #99, step change increases in iron have been observed to precipitate that changes in SOx emissions. These step change increases in emissions are easily controlled by SOx reducing additive.
It is recommended that the process engineer monitor closely the levels of add-on iron and total contaminant metals. Both of these variables may be plotted against bottoms conversion or conversion. The refiner may then draw their own conclusion regarding maximum allowable iron contamination. Three methodologies exist for combating iron excursions include: 1) flush catalyst, 2) higher fresh catalyst additions &/or 3) reformulation to a more iron tolerance catalyst system.
Finally, Intercat would like to propose an alternative explanation to the underlying mechanism leading to nodule formation in iron contaminated units. It has been observed that the composition of these nodules is not solely iron but is enriched with silica. Interestingly, one would expect that beneath the iron nodules there would be silica depleted regions within the catalyst particle. However, this is not the case. The composition of the catalyst directly beneath the iron nodule has equivalent silica concentrations as those regions not affected by these nodules. This leads us to hypothesize that iron acts as a nucleating site for silica/iron nodule formation. As stated earlier, these nodules have multiple negative impacts such as reduction in conversion, reduction in ABD, and occasionally, deterioration in fluidization characteristics. (Our thanks to Dr. Diddams for sharing this hypothesis with us.)
Ann Benoit (Grace Davison Refining Technologies)
Yaluris discussed that there are two types of iron. One type is particles of inorganic iron from hardware and is usually considered benign in FCC unit performance. The second type is organic based Fe potentially coming in with the feed and/or from hardware corrosion by naphthenic acids and other corrosive feed components. This type of iron can negatively impact unit performance. (1) ACE testing is a better technique to measure the conversion impact of organic based iron contaminated catalyst, compared to traditional fixed bed MAT testing. However, ACE testing should be used together with other tests to confirm iron poisoning.
Below are several methods that can be used to monitor catalyst performance under Fe contamination:
•Ecat analysis (Fe, Na, CaO, ABD, color)
•Scanning Electron Microscope imaging (SEM)
•Optical microscope
•Ecat diffusivity
A decline in unit performance such as, reduction in bottoms conversion, and/or poor catalyst circulation coupled with an increase in equilibrium catalyst Fe levels can indicate Fe poisoning. Yaluris discussed how pore closure and nodule formation can be potentially caused by iron contamination (1). Pore closure can negatively affect bottoms conversion in the unit. An excellent way to show the actual nodules is by Scanning Electron Microscope imaging (SEM). It is important to note that some nodules may not be a problem, but there is a problem when the nodules become obviously raised from the surface and all over the catalyst particle. A drop in ABD (apparent bulk density) on Ecat can indicate nodules formation due to iron poisoning as Ecat does not pack as densely. The ABD change, pore plugging and the potential for particles to stick together can negatively impact unit catalyst circulation.
Optical microscope is another method to indicate iron poisoning. Ecat samples with iron poisoning will show glassy reflections under an optical microscope with illumination. (1) The color of Ecat could potentially indicate high levels of Fe. Ecat samples can have a reddish brown tint when poisoned by iron.(1) In addition to Ecat Fe levels, Na and CaO should be monitored as well. Fe in the presence of Na and/or CaO can act as a fluxing agent which can aggravate the effects of Fe.(1)
Year
2011
Process

Question 41: Have the panel members considered 15% ethanol (E15) gasoline blending?
KOONTZ (HollyFrontier)
My first slide shows a little background. The EPA administers the Renewable Fuel Standard program that has volume requirements for renewable fuels. They established these volume requirements under the Energy Independence and Security Act of 2007. The EPA tracks compliance with the Renewable Identification Number (RIN) system, and they assigned a RIN to each gallon of renewable fuel.

HollyFrontier satisfies much of its requirement for conventional biofuel, which is essentially corn ethanol, by blending E10 gasoline at many of its terminals. Most of HollyFrontier’s gasoline is sold via pipeline to terminals owned by others; therefore, we are not able to supply our full mandated volume. HollyFrontier does purchase RINs from others. The decision to purchase ethanol to blend or the RINs is based on the economics of the cost of the RINs.

Ethanol blending for the refiner does have a significant impact on two critical gasoline properties: namely, octane and RVP. The hydrocarbon blend stock used for 90% of the E10product, which HollyFrontier calls sub-grade, has an octane rating of about 84. After blending with the 10% ethanol, the resulting octane is the regular 87. So being a refinery that adjusts total octane with its reformer severity, this allows us to run a lower severity, which is especially beneficial to those refineries with semi-regen reformers that operate at relatively high pressures and relatively low liquid volume product yield.

RVP is the other critical property affected by blending. When ethanol is blended with naphtha at a low concentration, the RVP of the gasoline is increased. Pure ethanol does have a low RVP; but when it is blended with hydrocarbon, it behaves more like a light hydrocarbon and actually raises the RVP. For example, with E10 for naphtha having an RVP of 9, the resultantE10 product has an RVP of about 10. So, to encourage ethanol blending, in 1990, the U.S. Congress passed a waiver known as the “One-Pound Waiver” which allows E10 gasoline to be sold at one psi (pound per square inch) higher than that normally required.
For the refinery, E15 would allow lower octane severity reformer operation, which would be beneficial. However, the EPA regulation implementing the “One-Pound Waiver” specifically references gasoline containing between 9% and 10% ethanol. The EPA has refused to extend this One Pounder Waiver to E15. Therefore, marketing E15 requires a sub-grade blendstock that has an RVP approximately 1 psi lower than normal gasoline sub-grade blendstock used for E10.

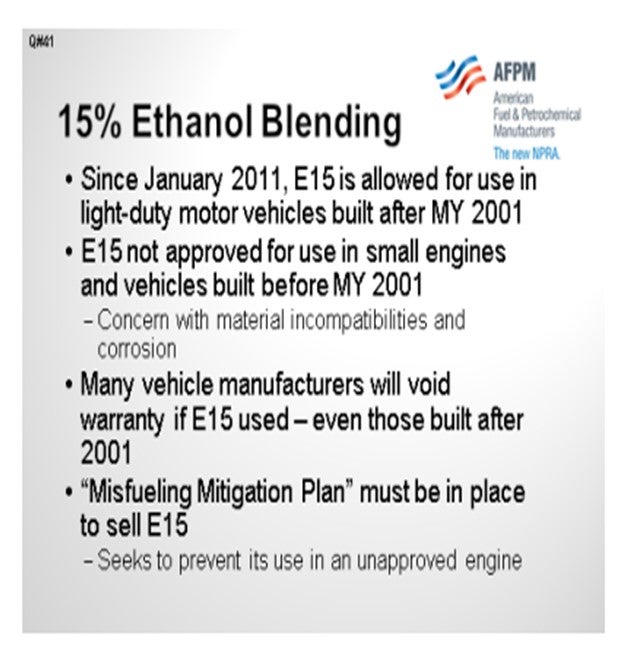
In addition, since January 2011, E15 has been permitted for use in light-duty motor vehicles manufactured after 2001. It was not approved to be used in small gasoline engines or other vehicles built before that due to concerns of material incompatibilities and corrosion. Furthermore, I have seen several places where current automobile manufacturers will not honor their warranties if the person used E15, even if the vehicle was manufactured after 2001. Also, the EPA requires that in order to sell E15 gasoline, a Misfuelling Mitigation Plan must be in place to prevent consumers from using the product in an unapproved engine. Today, there are very few retailers who have chosen to go through the additional trouble in order to sell the E15.
In conclusion, due to the absence of the “One-Pound Waiver” and the legal risk of corrosion or voiding the warranties of customers’ cars, HollyFrontier has chosen not to produce or blend E15.
SUBHASH SINGHAL (Kuwait National Petroleum Company)
Does the 15% have to do with the oxygen in the ethanol and other oxygenate like MTBE, or it is just because of the RVP limitations and other issues that you explained? From safety point of view, is there oxygen contained in the old oxygenate like ethanol? Is that one of the criteria for limiting the blending from 15% or 10%? Does this have to do with the oxygen
attached even though it is oxygenate?
KOONTZ (HollyFrontier)
My understanding, from reading, is that the E15 decision is not really based on logic. I think it was more of a U.S. Congress action. I do not really understand why they have not extended the “One-Pound Waiver” to E15. I do not think it is based on science.
KOONTZ (HollyFrontier Corporation)
The Environmental Protection Agency (EPA) administers the Renewable Fuel Standard (RFS) program with volume requirements for several categories of renewable fuels. EPA establishes the volume requirements for each category based on EISA (Energy Independence and Security Act of 2007) legislated volumes and fuel availability. EPA tracks compliance through the Renewable Identification Number (RIN) system, which assigns a RIN to each gallon of renewable fuel.
HollyFrontier satisfies much of its requirement for Conventional Biofuel (essentially corn ethanol) usage within RFS by selling E10 (10% ethanol) at many of its terminals. Most of HFs’ gasoline is sold via pipeline to terminals owned by others; therefore, to fully satisfy its mandated volume, HF purchases RINs from others. The decision to purchase ethanol from others and blend to E10 or to purchase RINs from others is based on economics.
Ethanol blending has a significant impact on two critical gasoline properties controlled by the refiner: octane and RVP. The hydrocarbon blendstock used for 90% of the E10 product (termed sub-grade by HF) has an octane rating of ~84. After blending with 10% ethanol (octane ~114) the resultant E10 octane is “regular” 87. For a refinery that normally adjusts reformer severity to satisfy the total gasoline pool octane, producing sub-grade allows for lower reformer severity and higher liquid yield. This improved yield is more pronounced for a semi-regeneration reformer that operates at relatively high pressure.
RVP is the other critical gasoline property affected by ethanol blending. When ethanol is blended with naphtha at low concentration, the RVP of the gasoline is increased. Even though pure ethanol has a low RVP [about 2 psia (pounds per square inch absolute)] due to O-H bonding, it behaves more like a hydrocarbon with a molecular weight of 46 when mixed with naphtha at low concentration. If ethanol is blended to 10% with 84 octane naphtha having an RVP of 9, the resultant E10 gasoline has an RVP of ~10. In order to encourage ethanol blending, the U.S. Congress passed the One-Pound Waiver in 1990 allowing E10 gasoline RVP to be 1 psi higher than that normally required by the EPA (One-Pound Waiver).
E15 would allow a refiner to produce an even lower octane sub-grade to blend with the ethanol and the RVP effect would be similar. However, the EPA regulation implementing the One-Pound Waiver specifically references gasoline containing between 9% and 10% ethanol. The EPA has refused to extend the one-pound waiver to E15. Therefore, to market E15 requires a sub-grade blendstock having an RVP over 1 psi lower than that required for E10.
Since January 2011, E15 has been permitted for use in light-duty motor vehicles manufactured after 2001. However, it is not approved for use in small engines and older vehicles due to concerns with material incompatibilities and corrosion. Furthermore, several automobile manufacturers will not honor their warranties if E15 gasoline was used in the vehicle (even for those manufactured after 2001). The EPA requires that in order to sell E15 gasoline, a Misfueling Mitigation Plan must be in place to prevent consumers from using the product in an unapproved engine. There are very few retailers who have chosen to get approval to sell E15.
Due to the absence of the One-Pound Waiver for RVP, the significant legal risk in selling a controversial product, and the minimal market demand HF has decided that it would be unwise to enter the E15 market at this time.
Year
2012
Process
Question 91: What are the characteristics of FCC catalyst to minimize particulate emissions at the stack?
John Aikman (Grace Catalysts Technologies)
While there are several operational and mechanical factors that can influence a unit’s particulate emissions, the question asks specifically about the FCC catalyst; as such, the following discussion will address characteristics of fresh catalyst only.
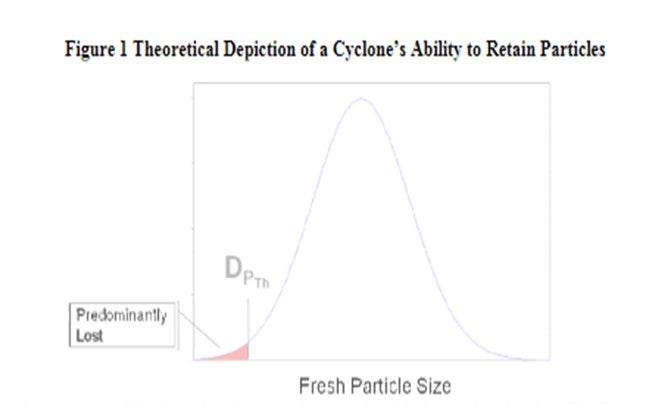
There are four basic characteristics of FCC catalyst that can have direct effects on particulate emissions. These same characteristics will also affect particulate losses to the fractionator and slurry product. The first characteristic is simply the amount of fines content coming into the unit with the fresh catalyst due to the manufacturing process. Figure 1 is an example of a typical fresh catalyst particle size distribution, with a theoretical depiction of a cyclone’s ability to retain fresh catalyst particles. DPTh is the smallest particle diameter which can reliably be collected by a cyclone and is used to model cyclone performance. Particles below this size will be lost by the cyclone.
A review of the Grace Ecat database showed that none of the FCCU’s in North America can retain any 0-20 μ range particles. In addition, they only retain an average of approximately 4.0 wt% in the 0-40 μrange. Fresh catalyst typically ranges anywhere from 9 to 16% of 0-40 μ depending on the supplier andmanufacturing process. Some units require higher amounts of 0-40 μ range particles to help with circulation.
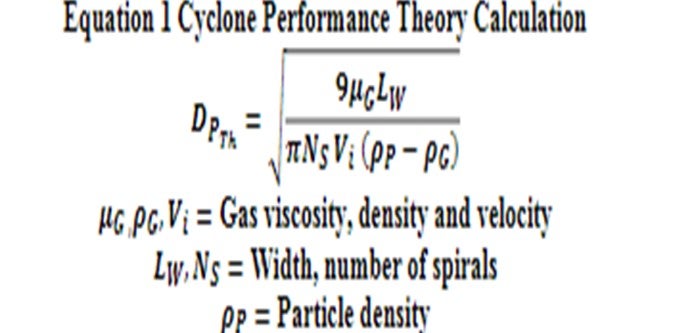
The next characteristic of fresh catalyst that must be considered is the particle density. he DPTh mentioned above will decrease with increased catalyst particle density, per Equation 1 below. This means that cyclones can retain smaller particle sizes as the particle density increases. This is due to the centrifugal force acting on a heavier particle. However, particle density is not the same as apparent bulk density (ABD). Industry typically measures and reports ABD as part of the routine Ecat analysis, but this should not be mistaken for particle density for cyclone efficiency purposes. Since Al2O3 is denser than SiO2, catalysts with higher alumina content will have higher catalyst particle density.
The third characteristic is the inherent attrition resistance of the fresh catalyst. Industry measures the attrition resistance via a variety of tests, with the primary goal of providing a relative indication of catalyst attrition resistance. Grace utilizes the DI test or Davison Index. On the DI scale, a lower number is less likely to cause attrition and generate microfines. It is usually not valid to compare attrition resistance results obtained from different laboratories. Additionally, it is important to note that the energy applied to a catalyst sample during attrition testing is much more severe than commercial conditions.
As discussed above, the majority of the microfines created in the FCCU will leave the unit through either the reactor or regenerator cyclones, with the latter potentially contributing to increased particulate emissions at the stack.
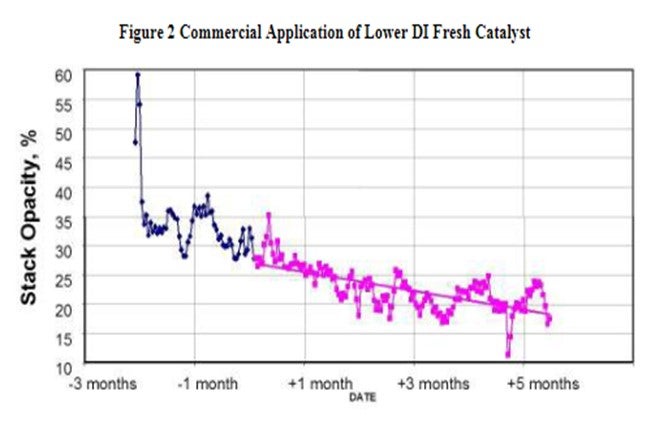
'The attrition resistance of the catalyst is a function of the manufacturing process and the binder material utilized during the manufacturing process. Figure 2 is an example of how a refiner improved the FCCU stack opacity with catalyst formulation. The reduction was achieved changing to a Grace supplied catalyst with lower DI and lower 0-40 μ content in the fresh catalyst.
The final characteristic of fresh catalyst that affects particulate emissions is its morphology. Morphology can be defined as the study of the form and structure of a particle and its specific structural features. A catalyst particle that has a smoother exterior surface is less likely to generate microfines in an FCCU. Even catalysts with a low fresh DI measurement can cause increased particulate emissions if there are surface irregularities resulting from the manufacturing process. In order to demonstrate this visually, Figures 3 and 4 present SEM’s (scanning electron microscopy) of “bad” and “good” fresh catalyst morphology for a side-by-side comparison.
Figure 3 and 4 SEM’s of Fresh Catalyst (magnified X250)
“Bad Morphology” “Good Morphology” In conclusion, there are several characteristics of fresh catalyst that can be controlled to reduce particle losses and thereby reduce flue gas emissions. Specifically, to lower emissions the fresh FCCcatalyst should possess the following characteristics: a particle size distribution with an optimal range of 0-40 μ particles, higher catalyst particle density, lower DI, and superior morphology. Grace’s alumina-sol technology provides superior binding to the catalyst particle leading to best-in-industry attrition resistance. The versatility and performance of alumina-sol catalysts coupled with Grace’s manufacturing capability, have resulted in wide-market acceptance and as a result, Grace is the preferred FCC technology for loss sensitive units around the world.
Year
2014
Process
Question 65: What are the impacts on coker operation (yields, capacity, energy, coke quality) of FCC slurry oil in the feed?
Gary Gianzon (Marathon Petroleum Company)
When one of MPC’s refineries starts processing heavy Canadian resid, they add 5 to 10 volume percent of slurry oil in the feed to mitigate making shot coke. The slurry also helps meet anode grade specifications on metals and sulfur. Processing slurry backs out resid processing which can impact unit economics.
FCCU slurry has a similar boiling range to heavy coker gasoil, so a large amount of slurry flashes out of the drum and ends up in the heavy coker gasoil product. The coke yield from slurry feed is around 2 to 3 x Concarbon (depending on coker unit operation) which is significantly higher than vacuum resid at 1.3 to 1.6 x Concarbon. If a high percentage (over 10 percent) of slurry is processed in the coker unit, the slurry can cycle up between the coker and FCCU unit. The amount of recycle built-up is somewhat self-correcting depending on operations in the coker and FCC and whether the HCGO is processed in a FCCU Feed Hydroteater.
Rajkumar Ghosh (Indian Oil Corporation)
We are adding approx. 3–4 wt% FCC Slurry oil in Coker feed in one of our Coker and about 10 wt% in another. We also had undertaken a study in the Delayed Coker pilot plant in our R&D centre. Our experiences with processing of FCC slurry oil in the Coker feed, based on field and pilot plant results, are as under:
a) Yield: The impact of slurry oil in Coker feed depends upon the quality of the base feedstock, CLO/slurry oil and also the pressure / temperature of the coke drums. If FCC slurry oil boiling point distribution and the coke drum pressure / temperature are such that most of the slurry oil vaporizes out of the coke drum, yield of coke and gas reduces with increase in distillate yield.
In case of Fuel grade Coker, with CLO (with minimum overlap of LCO) below 10wt% in VR feed, coke yield by and large may be constant or may increase marginally depending on the relative quality of VR and CLO. Yields of total gas and liquid decrease marginally. Beyond 10 wt% (10-20 wt%) of CLO in VR feed, the coke yield may increase up to 4 wt%.
b) Capacity: The Coke produced with significant FCC slurry in Coker feed (>10 wt%) has a close-knit Coke matrix which ensures good porous structure to the Coke bed. This reduces the chances of hot spots and blowouts. But the negative impact of adding FCC slurry is pronounced where the coke drum is already limiting, as the porous structure results in lower coke bed bulk density and hence lesser vapor space in the Coke Drum. It may limit the Coker capacity.
c) Product quality: Tendency of formation of Shot coke significantly reduces with the addition of FCC slurry in the Coker feed, as it keeps asphaltenes in solution form. As per our experience at Panipat Coker, impact of slurry addition in the Coker feed is clearly visible on the Coke quality w.r.t. reduction in Shot coke formation. With increased FCC slurry in Coker feed, increase in Silica content in the green Coke would be a criterion to limit its wt% in the feed. This is significant for the Cokers producing Anode grade coke. Typical limit of Silica in Anode grade green Coke is 0.02 wt % max. Depending on the quality of the slurry oil and unit operating conditions, there may be a negative impact on the quality of the LCGO and HCGO. They will become more aromatics and heavier.
d) Energy: Slurry processing will require higher heater duty. High aromatic content in the slurry oil prevents the precipitation of Asphaltenes and thus increases the heater run length. Injection of slurry oil into the coke feed is limited by refinery configuration. In our Refineries with FCC and/or Hydrocracking units, we limit the slurry oil within 5 to 10 wt% on fresh feed to Coker. Increase in injection rate can lead to a massive recycle between the Coker and the FCC or will result in accelerated catalyst deactivation in the Hydrocracker unit.
Eberhard Lucke (Commonwealth E&C)
In general, FCC Slurry has a similar effect as VGO in terms that it replaces residue in the feed and increases mainly the HCGO yield. The difference in this case is that FCC Slurry is a highly aromatic stream and is often used as additional Coker feed (up to 15wt% max. recommended) to reduce heater fouling and to push coke morphology to sponge coke (for anode grade coke). The heavy aromatics in the FCC Slurry help keeping asphaltenes in solution a lot longer and promote coke formation by poly-condensation, therefore increasing sponge type coke content in the coke bed (preferred for low sulfur, anode grade coke production). On the downside, FCC Slurry will contain entrained catalyst fines and – if too high in concentration – may have a negative impact on fouling rates in the charge heater(s). The fine catalyst particles can deposit inside the heater tubes, act as seeds for coking and may promote deposits of heavy oil and coke fines from the oil film inside the tubes.
Year
2011
Process
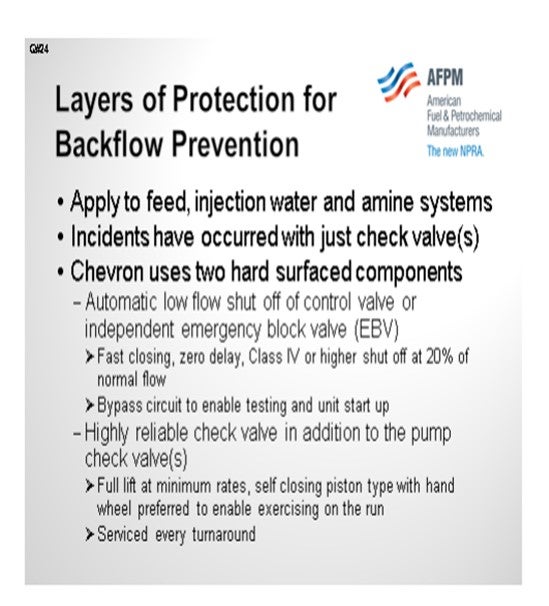
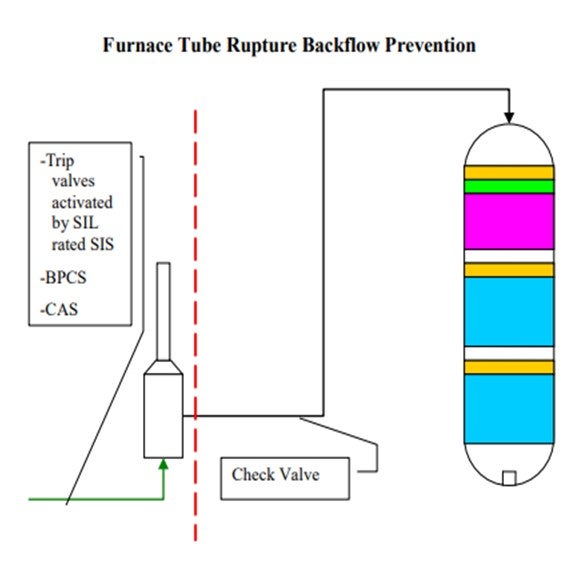
Question 24: Given the potential consequences of back flow in high pressure hydroprocessing services, such as furnace tube rupture and pump shutdown, what layers of protection are being employed to reduce risk?
ESTEBAN (Suncor Energy, Inc.)
We are going to skip the first slide.
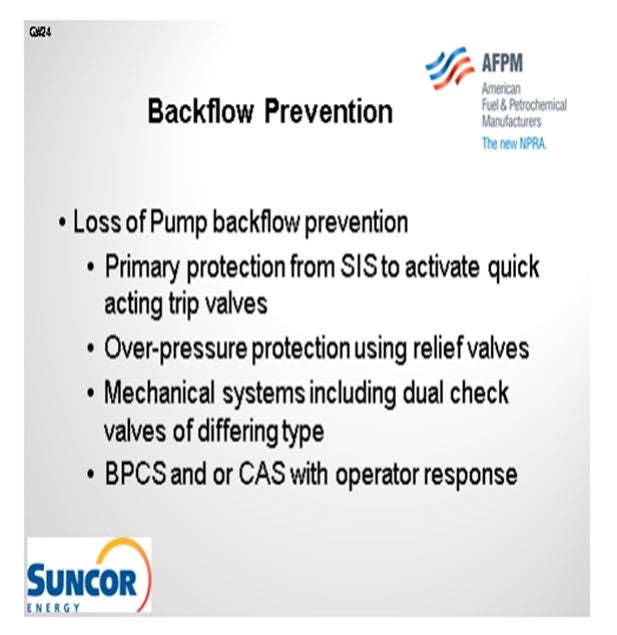
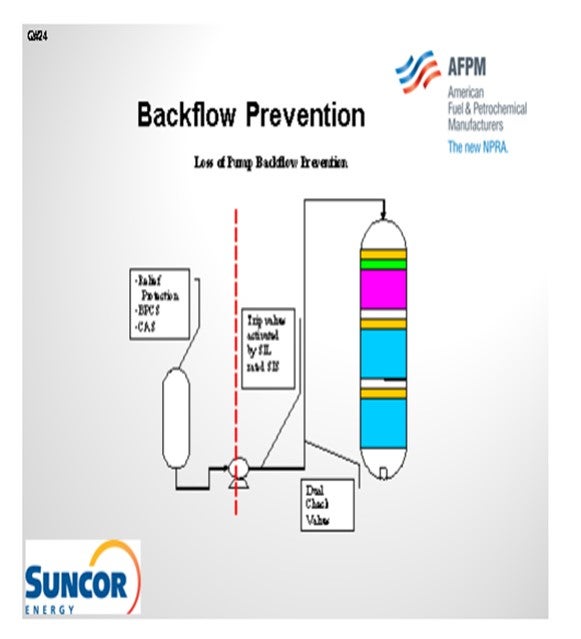
The second slide shows a simple depiction of the layers of protection that we use at our different sites. In some cases, we have relief protection, basic process controls, and critical alarm systems on our feed drums to prevent a backflow scenario or the consequences of a backflow scenario. That being said, though, relief valves do not always provide an adequate level of protection for high pressure units. So obviously, take that with a grain of salt. Our primary layer of protection is provided by our trip valves which are activated by SIL-rated instruments. We do not have an SIL rating in all cases; but in some cases, it is required to get the level of protection we need. And then, of course, we also employ dual check valves of differing types downstream of our pumps. Those check valves will typically wind up on our critical check valve system as well.
The scenario is similar where you have backflow. It is not so much the concern of backflow of reactor contents through the furnace, but more just a loss of containment in the furnace itself. We do not treat these furnaces in our hydroprocessing units any differently than we do any of our other furnaces in the refinery. They all have an integrity operating window that we would like to stay in. That window defines at what burner pressures we need to operate and, of course, at what skin and overall box temperatures we can operate.
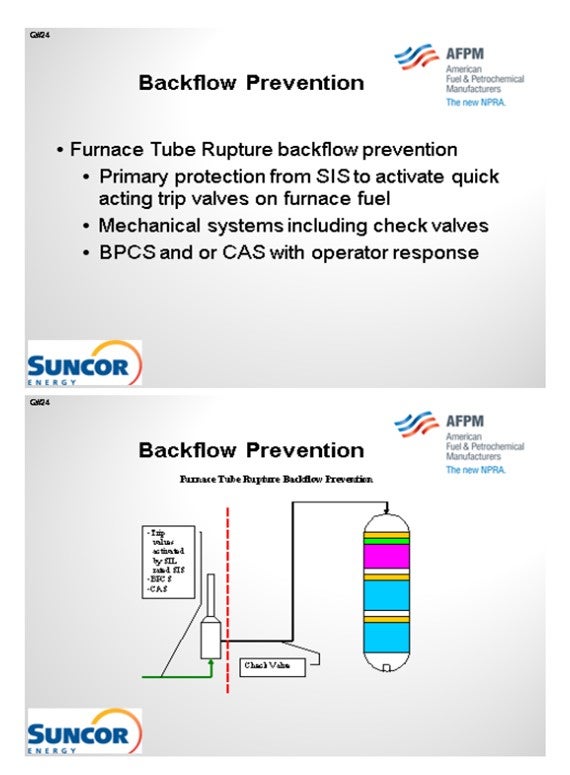
Our layers of protection are very similar here in that we have trip valves activated by SIL-rated instruments and which are only SIL-rated as required. And of course, we have basic process controls and critical alarm systems. In some, but not all, cases, we do have check valves downstream of our furnaces. That is not a standard at all our sites. However, on some sites, we are consistent about having check valves downstream of our furnaces.
KEVIN PROOPS (Solomon Associates)
I would like to comment on the heater part of the question. Reactor charge furnaces potentially have substantially higher consequences of failure than do most of the other furnaces in your refinery, so you need to be a lot more scared of them than you do of the other ones.
First, this is generally an exothermic process; so, the best case is probably that the furnace is not firing or is only minimally firing. Adequate feed-effluent heat exchange reduces firing and thus the risk of failure from flame impingement. Second is the inherent safety design. If you can go to a single-phase furnace instead of a two-phase furnace, then if it does rupture, your consequence will probably be a lot less. That also gets into the control system issues. Some refiners use hot oil utility instead of a fired heater in the hydrotreater. This is inherently safer.
Then you get into how to avoid a tube failure in the first place. There are a lot of ways to do that, but consider dry point in naphtha units, burner ring pressure controls and interlocks, and maintaining the cleanliness of the burners (fuel gas filtering). Adequate burner-to-tube spacing, feed filtration, tube monitoring (thermography), operator rounds frequency, and upgraded tube metallurgy can all add layers of protection.
Finally, it comes down to culture as well. You do not want to get into a situation of risk of a failure competing with profit to keep the unit maximizing at full throughput. Unfortunately, I have seen a case where that did happen: A furnace was experiencing flame impingement, and the operators did not reduce charge to the unit. After one shift, a tube failed, which led to the entire unit being consumed in a flash fire within a few seconds. We were very fortunate that there was no one outside at the time it happened; if there had been, we would have killed anyone in the unit.
ESTEBAN (Suncor Energy, Inc.)
We do treat them differently depending on their operating pressures and/or requirements. Certainly, from a design standpoint, the operating envelope for each individual piece of equipment changes how the furnace is designed overall. That being said, we evaluate all equipment using the same standard with a process hazard analysis to determine the appropriate layers of protection. Given the required layers of protection, we identify additional safeguards as required by LOPA. SIL-rated instruments, for example, are not required for all burner management systems. However, in some cases, they may be required because the consequences of failure are higher.
So yes, the consequences are significantly greater on a high-pressure furnace. The assessed risk ranking would define how those layers of protection will appear. In some cases, you will see a simpler system on a furnace; and in others, much more complex layers of protection will be applied because of the potential consequences of equipment failure for that furnace. So, to re-phrase my response, I will say that we evaluate every piece of equipment using the same processes.
ESTEBAN (Suncor Energy, Inc.)
In order to reduce the risk of potentially catastrophic consequences related to backflow in high pressure hydroprocessing services Suncor Energy, Inc. uses several independent layers of protection at operating pressure boundaries. One common boundary is for hydroprocessing units, is between the unit feed drum and the reactor charge pump. A typical hydroprocessing unit will have relatively low design pressure equipment upstream of the reactor charge pump which boosts the operating pressure of the feed stream to the much higher reactor operating pressure. As such preventing back flow in the event of the loss of a feed charge pump is critical to prevent equipment failure in upstream equipment with catastrophic consequences. In this application Suncor Energy, Inc. applies the use the following layers of protection:
1. Primary protection is typically a Safety Instrumented System (SIS) that monitors the run status of the feed charge pump via multiple direct and indirect instrumented signals and activates quick acting trip valves and in some cases closes the feed charge control valves in the event of a shutdown. In some cases, depending on the unit specific hazard analysis these systems may be SIL-rated to ensure reliable operation when activated. In addition, these systems are often designed to be activated by any one of several different instruments used to sense a potential backflow scenario, i.e., low-low flow shutdowns and low-low feed controller differential pressure shutdowns.
2. In some cases, pressure relief valves are used as layers of protection for overpressure due to backflow, but caution must be applied when relying on a relief valve as protection for vessels, such as feed drums, since these valves are not always sized for backflow scenarios.
3. Mechanical safety systems are also employed depending on unit design. While these systems are often not credited in a process hazard analysis of a unit they can provide additional layers of protection. Typical installations include dual check valves of different design which are often deemed critical check valves that require routine maintenance.
4. Provided the design of the system and equipment in some cases basic process controls and/or critical alarms with operator response are employed as additional layers of protection.

In addition to backflow prevention and protection as it relates to pressure boundaries, furnace tube ruptures can result in backflow from multiple large high-pressure vessels to atmosphere with catastrophic consequences. In order to address the release of reactor and high-pressure circuit equipment, layers of protection must be applied to the feed furnaces that prevent operating windows that have the potential to create damage resulting in tube rupture. The layers of protection employed for this scenario do not differ from those on other furnaces in Suncor’s refineries, as all furnaces are evaluated for tube rupture scenarios. However, in this application Suncor Energy, Inc. applies the use of the following layers of protection:
1. Primary protection is typically a SIS that monitors furnace flows, temperatures, and fuel and box pressures via multiple direct and indirect instrumented signals and activates quick acting trip valves on fuel supply and in some cases closes the fuel supply control valves in the event of operation outside a preset operating window. These SISs often activate related SISs to stop process flows. In some cases, depending on the unit specific hazard analysis these systems may be SIL-rated to ensure reliable operation when activated. In addition, these systems are often designed to be activated by any one of several different instruments used to sense operation outside of the specified window, i.e., low-low flow shutdowns and high-high burner pressure shutdowns.
2. Mechanical safety systems are also employed depending on unit design. While these systems are often not credited in a process hazard analysis of a unit, they can provide additional layers of protection. Typical installations include check valves downstream of furnaces to prevent the backflow of reactor contents. In general, these check valves are not relied upon as fail-safe devices and are not considered critical check valves.
3. Provided the design of the system and equipment in some cases basic process controls and/or critical alarms with operator response are employed as additional layers of protection.
Year
2012
Process