Question 93: Which key process indicators (KPIs) are tracked in a typical FCC unit health monitoring program, and what is the frequency these indicators are measured?
INKIM (PETROTRIN)
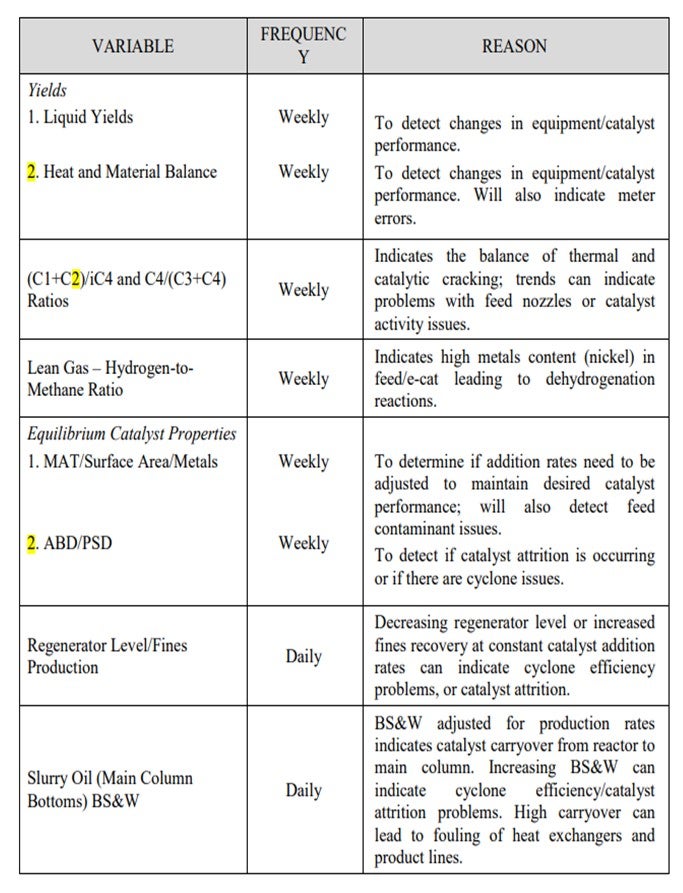
There are several KPIs that are tracked in the monitoring of FCC. Liquidy yields is one parameter that is monitored daily to detect any changes in equipment and catalyst performance. The BS&W (base sediment and water) in the main column bottoms is checked daily as well to monitor the catalyst carryover from the reactor into the main column. The heat and material balance should be done at least weekly, if not daily, to detect changes in the catalyst and equipment performance and to detect any meter errors. In the lean gas stream, the hydrogen-to-methane ratio is monitored weekly as it indicates higher metals content in the feed.
Another KPI that we track at least weekly is the e-cat properties to detect any feed contaminant issues. There are other KPIs that we monitor, and these are mentioned in my Answer Book response.
LARSON (KBC Advanced Technologies, Inc.)
In all cases, it is important to establish the baselines. Then what you are really trying to do is track your standard deviation because you need to know the cause and effect versus normal deviation. The cat cracker conversion might vary as much as 1%. So, looking at absolute values, as opposed to relative deviation, is really important. You get some of the KPIs directly; others are calculated from lab data or rigorous modeling. It is important to differentiate so you know the accuracy of the values you are using and how much they will change. We have typically lumped things into operating things or operating instruction KPIs, and then we also look at planning because planning will give you targets to target. Planning is target to target. Boy! That is oxymoronic.
Planning Targets: You need to hit those. Make sure your lab and operating systems are set up to work in conjunction with operational moves. We will typically look at reactor temperature which will give an indication of octane in conversion. We also look at the debutanized octane material monitoring what the RVP (Reid Vapor Pressure) of the material is; because as RVP changes, you will be changing octane. Refiners do not check their feed quality as often as we would expect. Operators are often chasing product quality when, in reality, there was, a burp in the feed quality, and it was missed until it is three days down the road.
Key Constraints: Map your constraints if you are operating up against them. Know your air blower capacity limit, whether it is the horsepower, blower discharge, or wet gas compressor horsepower. Is it a DP (differential pressure)? Many units are now running a low DP on slide valves encroaching nearer the shutdown trip points, so monitor your unit constraints very well. On a longer term or monthly basis, monitor your catalyst activity for metals and look at your fines.
One of the comments is taken this from the last NPRA (National Petrochemical and Refiners Association) Cat Cracking Session. The EPA (Environmental Protection Agency) came into the meeting and talked about the new regulations that will be coming to the FCC flue gas system. Particulate analysis that crosses your cat cracker will be one of the key criteria you will need to map, if you do not have it now. Many places that did not have upsets are not aware of what the particle distribution is on the slurry bottoms. They do not know the particle distribution of the fines caught. They do not know the particle distribution and are asked to do a cyclone analysis. Track your particle distribution on a regular basis, monthly or at least quarterly, so you have a baseline and know when things change.
We would also look at gasoline selectivity, as well as expansion on a unit, to ensure that catalysts are performing appropriately. We look at the LPG to LCO yield to make sure we are getting the correct cracking distribution and proper fractionating. This is an operator guideline. Are we getting good overlaps or gaps? What is the basis of your operation? How well are your operators performing against that basis?
On the utility side, we look at steam production and/or exchange or fouling to determine if we are getting the right value out of the preheat or if the steam generators are on the slurry circuit. These can be tracked daily or weekly. The bottom line is to monitor them frequently enough so that when you see deviation, you will know it is real as opposed to chasing ghosts. There are enough operator and engineer elements that we have to do now between HAZOP (Hazard and Operability) and environmental regulations, so you must have an efficient way to confirm that you are making as much money on your unit as possible.
MUKESH PATEL (Reliance Industries Limited)
Under KPIs and field properties, are you monitoring total nitrogen or basic nitrogen? As I understand it, basic nitrogen is more important than total nitrogen.
LARSON (KBC Advanced Technologies, Inc.)
I recommend total nitrogen for a couple of reasons: First, as soon as you begin to crack a molecule, you will take that which was in a total system. You will actually create more basic nitrogen just due to the nature of the cracking of the molecule. Second, every refinery I have reviewed in the last 10 years has not really been set up to do a basic analysis. They have a total nitrogen analyzer because of their hydroprocessing units. So, tracking the total nitrogen is just as effective as tracking basic nitrogen and watching the delta impact. It is the relative change away from your normal average feed. I have worked in enough different models, besides the one that KBC is selling, to know that you can use total nitrogen just effectively as basic.
MUKESH PATEL (Reliance Industries Limited)
How do you include the basic nitrogen in your simulation?
LARSON (KBC Advanced Technologies, Inc.)
There are some rules of thumb that apply if you want total to basic. If it is virgin oil, we would apply a basic assumption that one-third of the total nitrogen is basic. If it is cracked, then more than one-third of it is basic. So, it depends upon its feedstock, but there are some rules of thumb that can be applied.
MUKESH PATEL (Reliance Industries Limited)
Many times, we see that the basic nitrogen thumb rule does not apply for various reasons.
LARSON (KBC Advanced Technologies, Inc.)
Nitrogen is a contaminant; so, it always applies, just that what it is in relationship with changes.
KEN BRUNO (Albemarle Corporation)
Please consult the Answer Book as we have provided a very thorough list of recommended Best Practices and KPIs that supplement the suggestions by the panel.
J.W. “BILL” WILSON (BP Products North America Inc.)
Many of these things are quite amenable to being tracked statistically, which helps a lot in actually identifying real deviation or, as Mel said, ‘chasing ghosts’ or chasing random deviations. It is very easy. You can do it with a spreadsheet. We have some specific programs to use, but you can do it about as well with an Excel or other spreadsheet.
WARREN LETZSCH (Technip USA)
I want to make a comment on nitrogen. I think total nitrogen is the best way to go. This is particularly true if you are running residual feeds because small nitrogen compounds in VGO really can affect the catalyst quite a bit. The nitrogen in the larger molecules and the 1050°F plus material really does not seem to be nearly as detrimental. It is typical to run 1500 or 2000 ppm of nitrogen with a residual feedstock. And if you run that with a VGO, you would see a serious deactivation of the catalyst. Total nitrogen is the best way to monitor this impact. I certainly agree with your one-third rule; we have always used that. And for regular VGOs, it is remarkably good.
CATHERINE INKIM (PETROTRIN)
LARSON (KBC Advanced Technologies, Inc.)
Key process indicators, or KPIs, can be broken down into two broad areas of operations (daily) and performance-based indicators and can be further divided into fluid solids systems, operational, and yield for more detailed analysis.
In all cases, it is important to establish base lines and track standard deviation. There will be cause-and-effect change versus the normal deviation or operation of any FCC, given the dynamics of the control systems and typical various of feed and severity.
Some KPIs are calculated or used from daily logs or lab data while others are obtained through the use of rigorous modeling of the reactor regenerator system, as well as the hydrocarbon recovery section. Many refiners will have daily KPIs used to monitor the unit against the operating instructions from the planning group. Those KPIs that require rigorous heat and mass balance will be completed by the pacesetter refinery once a week, using a routine and defined time to collect stream and process data.
The direct laboratory and operating data used in concert with kinetic modeling enhances the performance monitoring of the unit. The use of the kinetic model can differentiate the impact between catalyst, feed quality, and severity. Utilizing TBP (true boiling point) yields versus as yield data can be enlightening for both Operations and Engineering using more rigorous troubleshooting assistance.
It is possible to optimize cost (laboratory) to reduce duplicate samples without jeopardizing the value and accuracy of much needed weight balance data. In general, samples and analysis have three values: actionable by Operations (deviation from the setpoint target), key mass and heat balance reconciliation necessary for LP updates (economic tools must be kept current), and historical trending. The latter is critical for both hydrocarbon and water systems. The frequency and accuracy of the mass and heat balance is an indication of the value a refiner places on the economics of operation.
A list of some of the typical KPIs are shown below:
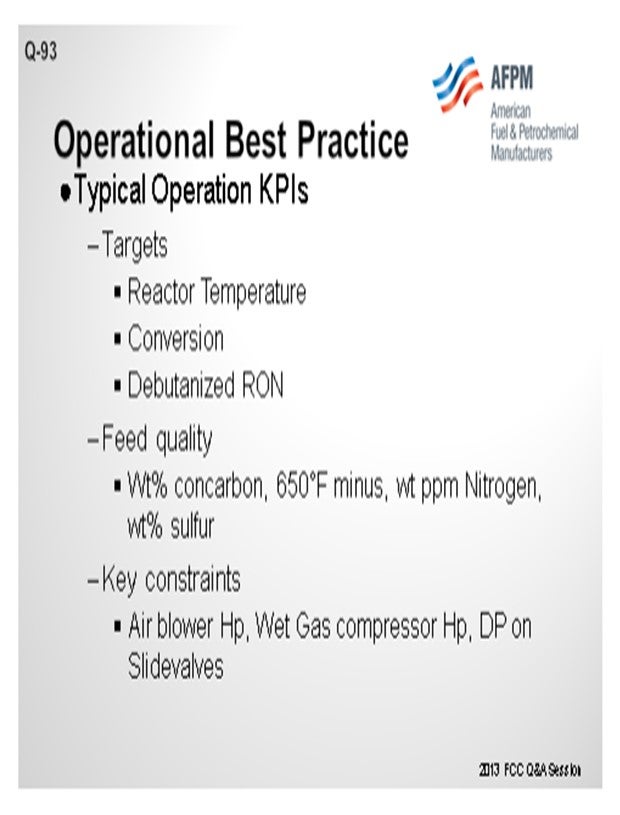
• Typical Operation KPIs
– Operating Conditions (daily)
• Conversion, debutanized RON, LPG yield
• Steam usage
Dispersion wt% on feed
Stripping steam rate – Feed Quality (daily)
– Feed Quality (daily)
• Wt% Conradson carbon, 650°F minus, wppm (weight parts per million) nitrogen, wt% sulfur
– Key Constraints (daily)
• Air blower HP (horsepower), wet gas compressor HP, ΔP on slide valves, ΔP on trays that might indicate flooding, turbine efficiency
– Catalyst Properties (monthly)
• Catalyst losses/opacity
– daily
• Metals/activity
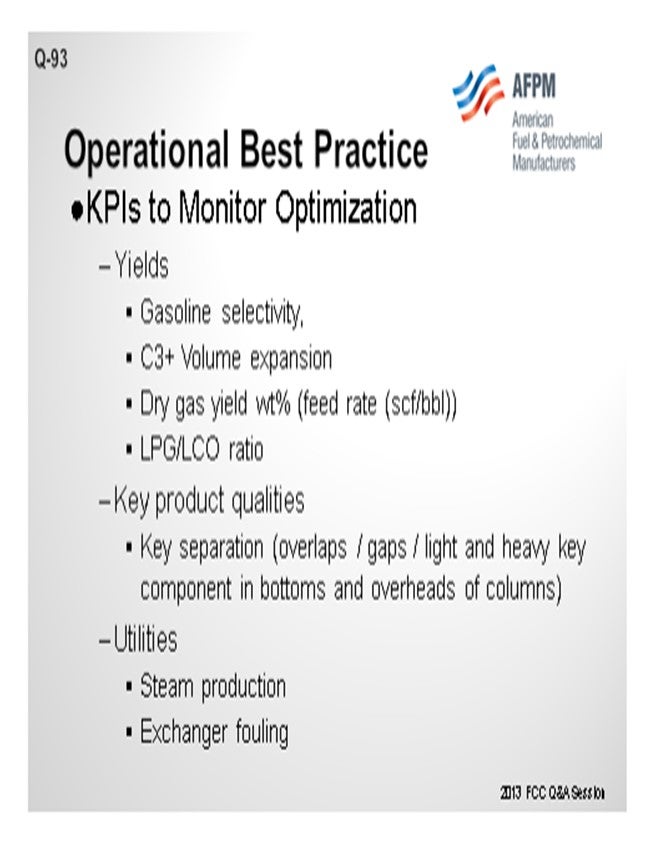
• KPIs to Monitor Optimization
– Yields
• Gasoline selectivity
• C3+ volume expansion
• Dry gas yield wt% [feed rate {scfb (standard cubic feet per barrel)}]
• LPG/LCO ratio
– Key Product Qualities
• RVP of gasoline, key separation (overlaps/gaps/light and heavy key component in bottoms and overheads of columns)
– Utilities
• Steam production
• Exchanger fouling
JACK WILCOX (Albemarle Corporation)
In order to monitor equipment reliability, as well as maintain optimum operation, the following KPIs should be tracked because they define the optimum FCCU operation:
On a continuous (daily) basis:
- Operating conditions, including:
a) Riser outlet temperature
b) Combined feed temperature
c) Catalyst circulation rate (catalyst/oil ratio)
- Feed rate and quality, including:
a) Density (API)
b) Boiling range
c) Key contaminant levels such as sulfur, nitrogen, heavy metals, etc.
- Catalyst properties
a) Fresh catalyst addition and withdrawal rates
- Key equipment constraints, including:
a) Main air blower limit
b) Wet gas compressor limit
c) Hydraulic constraints
d) Equipment temperature limitations
e) Key equipment operation, such as cyclone inlet vapor velocities, horsepower recovered (if unit has a PRT)
- Product yields and qualities
a) Product recovery limitations (fractionation, treating)
On a weekly basis:
- Test runs, including:
a) Complete heat and weight balance
b) Feed and product quality properties
c) Circulating catalyst, including both physical and chemical properties
d) Establishment of current limiting constraints
Once per year, and preferably a short time before and after a unit turnaround, a complete equipment and operational evaluation should be performed, including:
- A hydraulic survey, including:
a) A single-pressure gauge pressure survey of the entire reactor/regenerator section from the main column overhead to the flue gas recovery section; based on the single-gauge survey, a complete pressure balance of the reactor/regenerator is developed.
b) A single-gauge pressure survey of the main column and vapor recovery unit
- Thermography survey of the reactor/regenerator vessels
- Utility consumption, including all steam and air supply sources
- Critical equipment performance and limitations are established, including:
a) Cyclone solids and vapor loadings
b) Distributor pressure drops and nozzle exit velocities
c) Major rotating equipment, including the air blower, wet gas compressor, flue gas expander operation
- Establish flowing catalyst fluidization characteristics