Question 89: How are FCC simulation models being used as part of routine performance monitoring and optimization?
BULL (Valero Energy Corporation)
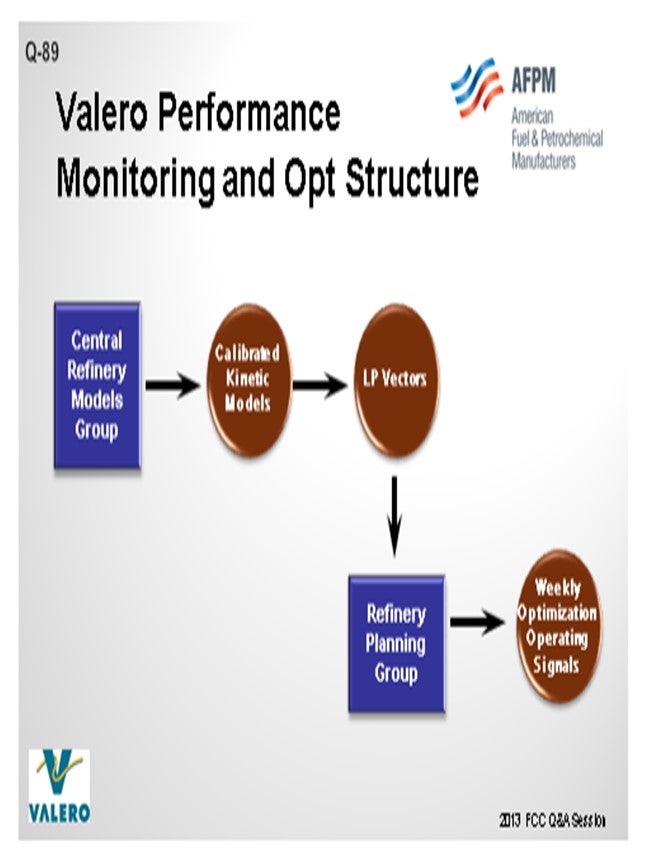
At Valero, we have a centralized group in the Planning & Economics area that is responsible for the kinetic modeling for all of the major process units. The primary driver behind the kinetic models at Valero is to get good data into our LP (linear program) models. The data from the FCC simulation is translated into LP vectors, which are used by our LP group to build LP models for each refinery. Using this data, we then do all of our crude selection, as well as our weekly, one-month, and three-month optimization plans in the LP.
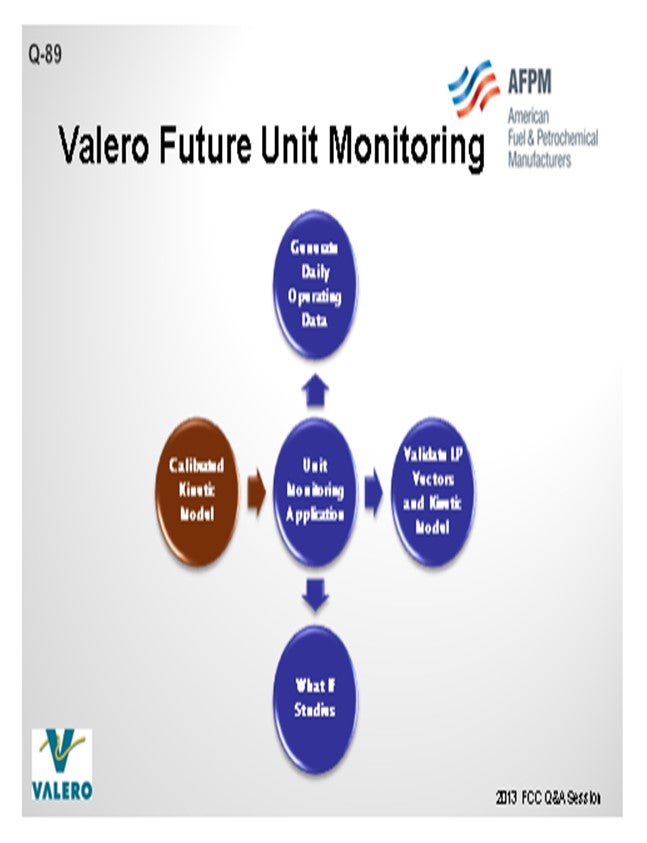
The other influence on simulation models is the engineers who use kinetic models at the refineries and also at the corporate level for different applications. Our group calibrates the kinetic models that are used throughout the company. We have put the kinetic models into unit monitoring applications at Valero to validate LP vectors. These models are also used to conduct what-if studies. The monitoring application also helps us generate our daily operating data. Usage varies greatly amongst the plants at Valero. Some of our refineries are running the kinetic models on a weekly basis. There are other plants that have probably not touched the kinetic model in the entire eight years that I have been at Valero; so, it is hit or miss.
One of our main goals is to train the engineers to leverage kinetic models to do optimizations, look at case studies, or troubleshoot. We need to make it easier for them to use so they will utilize the kinetic models. That is why we have a central group. It is our job to calibrate the model, ensure its accuracy, and then put it in a format that is easy to use.
STEVE GIM (Technip, Stone & Webster)
I have had the luxury of observing more than 200 units around the world over the last 20- plus years. As Jeff alluded, there is a great variation in terms of the quality of data that we get from our customers and how we go about using it to propose or benchmark future changes. Ideally, you would like to have test-run quality data and a stable unit operation associated with laboratory data, but this is not always the case. In terms of the actual use of the kinetic model for optimization and proposal of the operational changes, that would be the most ideal way to look at the operation. But in the absence of these conditions (for example, we only had access to raw pi data), another extreme way to monitor and engage their performance would be either simple time-based benchmarking or statistical benchmarking. My Answer Book response includes actual examples of these different types of benchmarking, ranging from easy to hard. For the sake of time, you can look at those examples and definitions at your convenience.
STUART FOSKETT (BASF Corporation)
I want to add an additional use that we have in service. We use the FCC simulation model from KBC. We have had a very successful experience using a catalyst database that we developed for catalyst factors for all of our various technologies, in combination with the optimizer, to fine-tune offerings for catalyst reformulations.
KEN BRUNO (Albemarle Corporation)
While some already use models, Albemarle strongly encourages all refiners to use their simulation model to do very careful post-audits, particularly around catalyst changes. Make sure that what got in the unit is, for example, what your laboratory would show in catalyst testing. It is critical to post-audit your units to make sure you are making the right decisions. If lab testing is also involved, use these results to make adjustments to how you translate your lab data to commercial projections.
LARSON (KBC Advanced Technologies, Inc.)
Since we were mentioned, one of the other strong values beyond the catalyst evaluation—the kinetic modeling—the platform actually gives you an extreme value in troubleshooting other elements of the unit: cycle velocities and bed velocities. The other values are gotten with kinetic modeling and go beyond simple yields. Based on my experience at KBC, I echo what Jeff said. Quite frankly, with the age of computers, kinetic models are actually underutilized. We are not getting the value of the information available, particularly as a training tool.
As younger engineers are coming through, using a model to train with is a safer alternative to adjusting an operating unit. You can go out and cultivate the models to teach them some of the fundamentals of the unit processing, so they will become better engineers in a more rapid startup into the process. We advocate not just for the purpose of kinetic modeling, but also for the training and troubleshooting aspects, to help you make a long-term profit potentially in your refinery.
ROBERT “BOB” LUDOLPH [Shell Global Solutions (US) Inc.]
When it comes to model calibration/fitting, are unit material balances used or are special tests surveys conducted? Once calibrated, do you attempt to validate the model with newly collected plant data?
BULL (Valero Energy Corporation)
Bob, to address that with the most recent version I will tell you that we utilize KBC models for all of our applications. The recent version 4.1 that is being implemented in our system contains a data reconciliation function, so we are using plant data to feed data reconciliation functions. The data reconciliation function actually trues up the mass balance to 100% before any information goes into the model. Within that platform, we also have designed the capacity for you to bring your data directly from the historian into the kinetic model. There is also data conditioning so we can go through and trap errors in the data. We can use data from a different timeframe when you have a bad flue gas analysis or a TI (temperature indicator) has failed. One of the benefits of the model is that it has allowed us to pin down the location of bad indicators in the laboratory or if it is a TI or flow meter. By performing this data reconciliation, we have more information to identify these issues.
In the past, engineers tried to show this on spreadsheets and then justify it with unreconciled plant data. Now we have it all on a database, so we know where the meters are off when doing the reconciliation. You also have the whole heat balance function which also goes into the evaluation, and you can back into some of your thermocouples and other analyses. Having historical data helps us with our justification to get meters or indicators fixed.
J.W. “BILL” WILSON (BP Products North America Inc.) I would like to ask Jeff for a little bit more clarification. As I understand, your group calibrates the models, generates the LP vectors, and puts them into the LP. Do you perform the actual LP work as well or turn it over to the refinery to operate?
BULL (Valero Energy Corporation)
We have a central LP group that is separate from our Kinetic Model group, so we have people who specialize in just the LPs. That is where the interface comes between our groups. We will generate the data and then check it ourselves. When we send it over to them, there is another check that is done inside the LP; so, there are two rounds before it actually gets sent to the plant.
J.W. “BILL” WILSON (BP Products North America Inc.)
But then the plant actually uses the LP for its short-term planning?
BULL (Valero Energy Corporation)
That is correct. All the planning work is done at the plant. We purchase all of our crude centrally, so that group is a strong user of these LPs as well.
JOE McLEAN (BASF Corporation)
I agree with all the good comments that have been said. We do use the KBC model extensively and incorporate it into all of our other data management systems that use for tech service, but there are drawbacks as well. One of the drawbacks of the model is that it is a steady-state predictive model. It will give you a prediction, but then it will assume that you will just sit there at those fixed conditions until you get to steady state. Of course, FCCs in the real world never run that way.
So, what we found works very well as a companion tool to accompany with the model is to include statistical analysis and multi-variable statistical regression, which is not that scientific by any means, but which is much better at handling transients. Just depending on the specific unit and how well it runs at constant conditions or how far it deviates from that, we may use one versus the other, or a combination of both, to get the best compromised solutions.
LARSON (KBC Advanced Technologies, Inc.)
To add to Bob’s point, one of the concerns that refiners have in collecting data is that they are going to overload the lab with certain laboratory analysis; so, there has been a trend to reduce the amount of lab schedules. I have personally done this. You can sequence your lab collection information so that it does not change the lab schedules or overload the lab. As a result, you can get weekly rigorous test data that is of high quality. If you look at your lab schedule appropriately and mirror what Jeff said Valero is doing in reconciliation of your data, as well as fine-tune the instruments that exist, you could have a reliable, high-quality set of data on a routine basis. But really, go to the lab work to make sure that you do not have the ghost of too many lab samples going in.
JEFFREY BULL (Valero Energy Corporation)
At Valero, we have a Central Refinery Models Group that is part of our Planning & Economics organization. The Refinery Models Group is responsible for the maintaining the kinetic models for every major process unit. FCC simulation models are used as part of routine optimization in two ways. As part of our planning process, the LP models are updated using data generated from the kinetic models. The LP models are used for refinery optimization on a weekly basis. This is an established work process used at all of our sites.
The other way that FCC simulation models are used for optimization is at the process engineer level. This is done in a less formal manner and varies from site to site. Some sites look at the unit performance on a weekly basis or conduct periodic case studies, and other Process Engineering departments do not use the kinetic models. It really depends on the culture at that site and the actual process engineer. As far as routine monitoring, we have recently explored using the kinetic models as a backbone for mass and heat balancing FCC units and then comparing actual performance to model predictions. We see benefits in establishing this work process but still need to quantify the best means to roll this out to our system.
STEVE GIM (Technip Stone & Webster)
Usage of FCC simulation models has to be put into a context of what is workable for day-to-day operation and what is not. For proper usage of FCC simulation models, it is prudent to have test-run quality data with unit stability and accurate lab data that correspond to the set of data we want to analyze. In the absence of these two conditions, we use descriptive and statistical analysis of available data on day-to-day basis. As required, FCC simulation models are used in three main areas of performance monitoring and optimization: (1) analyzing and benchmarking the performance of the FCC unit, (2) recommendations for improved unit performance, and (3) routine updates of FCC sub-model vectors in refinery LP.
Monitoring and Benchmarking
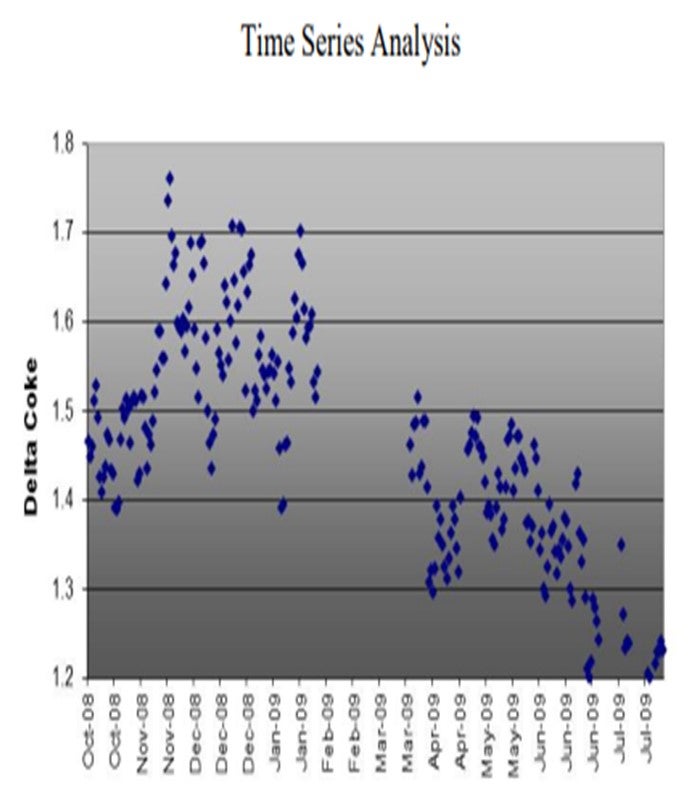
Time-Based Benchmarking
Time-based benchmarking offers visual interpretation of change in both the inputs (feed, catalyst, hardware changes, and independent operating variables, for example) and corresponding outputs (yields and dependent operating variables). These are simple plots that are routinely produced as part of weekly reports. Some of the examples are shown for clarity:
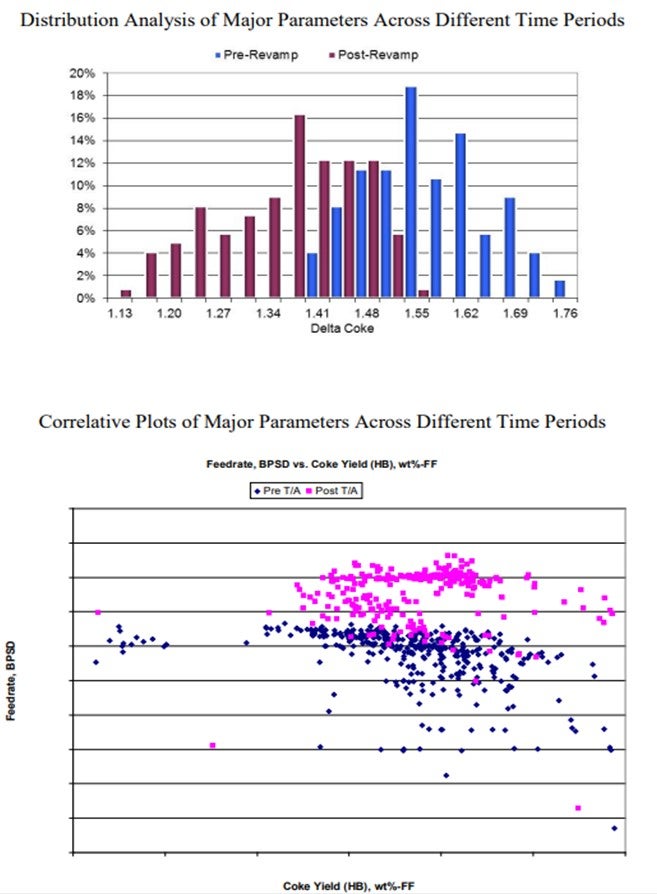
Statistical Benchmarking
Statistical analyses of various operating parameters serve several purposes. First, provide deeper understanding of distribution in both inputs and outputs of the unit has operation, as shown on the charts below.
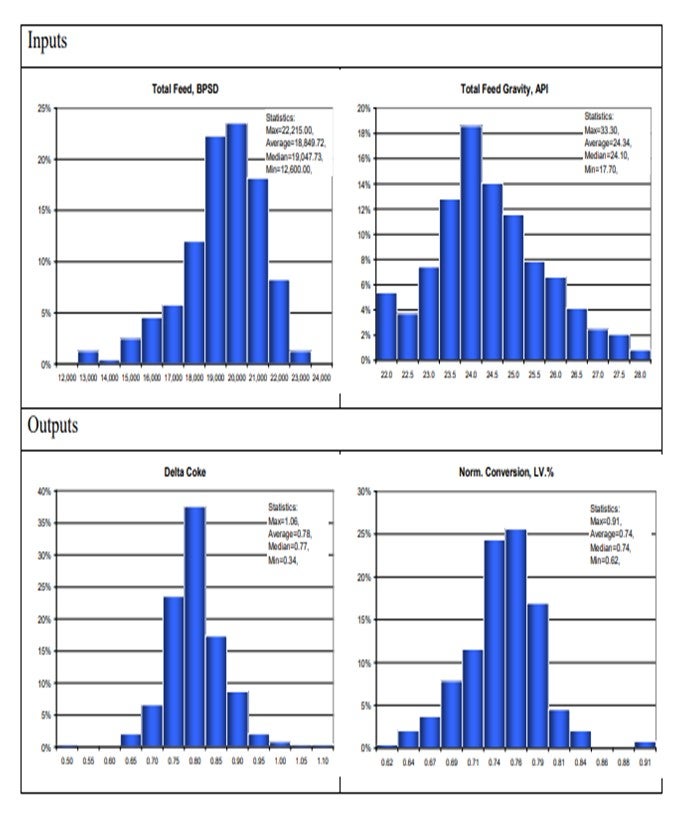
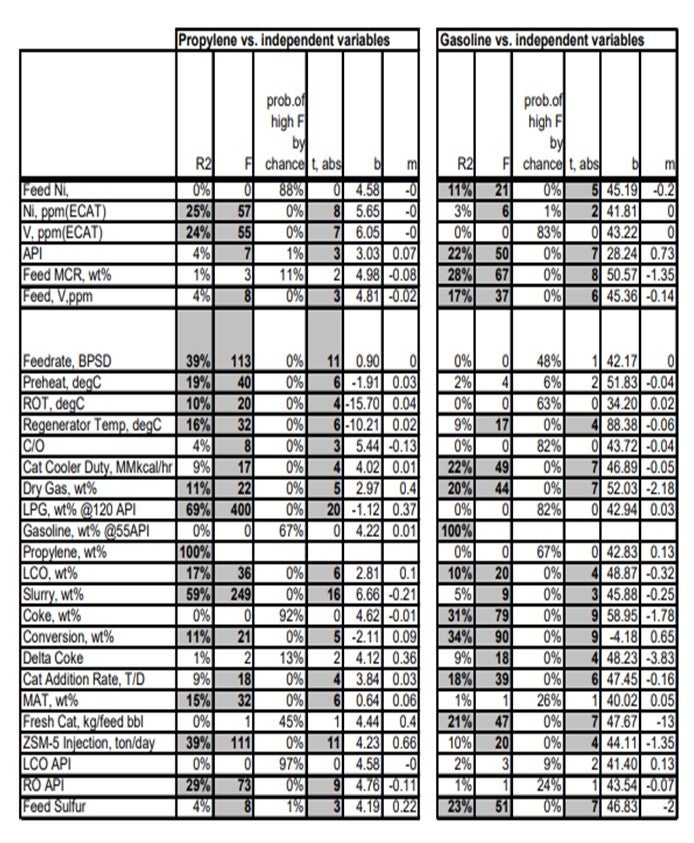
Secondly, create potentially valuable correlations, which are illustrated below:
Physical Benchmarking
Periodic check of the unit performance against various hardware of each FCC identifies both the bottlenecks and opportunities to improve the operation by installation of new technologies and/or revamping of the existing hardware. Yields and operating conditions can be checked against our physical simulation of the FCC as it is actually built. Catalyst fluxes, superficial velocities, and residence times in stripper and regenerator bed are some of the examples of physical attributes of as-built model against industry-accepted criteria.
Kinetic Benchmarking
Technip utilizes an in-house kinetic model co-developed with Axens, IFP, and Total for FCC yield prediction. Periodic “tuning” of the model using the actual operating data serves three purposes: (1) benchmarking the current performance of the unit in various key performance indicators, (2) forecasting and/or recommending future operation of the unit from fine-tuning operational parameters and/or inputs (feed blends, for example), and (3) back-testing the model to close the gap between predicted versus actual to fine-tune the capabilities of the kinetic model built specific for each unit.
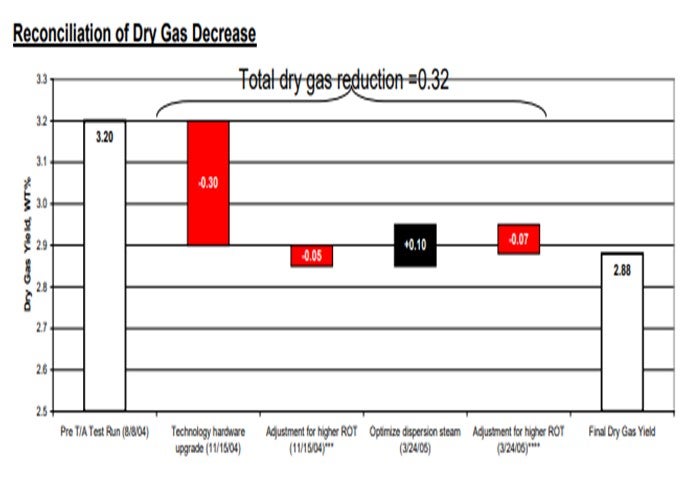
Reconciliation
Sizable shifts in feedstock properties, unit hardware, and operating conditions are reconciled using simulation models. Kinetic models can segregate individual effects to better understand the differing contribution of major shifts.
Update of LP Vectors for FCC Sub-model
Updates of the FCC sub-model of the linear program (LP) can be provided by FCC models. Perturbations of bulk feed properties and operating conditions, as well as their resulting yields vectors, are provided for the LP. They provide valuable refresh of FCC’s operations upon a step change in the feed qualities and/or hardware changes that provide a sizable shift in the unit has performance.
ALAN KRAMER (Albemarle Corporation)
Albemarle routinely uses FCC simulation models to support our customers’ operations. Simulator models provide an excellent platform for evaluating the impact of changes on an FCC unit, whether they are catalyst, feed, operational, or mechanical. There are four main ways by which we use models as part of our routine technical service support:
1. Forecasting with Optimization: We use simulators to help select the optimal catalyst formulation and operating parameters to maximize profitability. Most often, these results are used in a standalone manner; however, they can be fed to other process simulators (such as those for feed or product hydrotreaters) or used as inputs to refinery-wide LP models.
2. Unit Monitoring: We routinely feed unit operating data into our FCC simulators, especially during transition periods such as when changing catalysts. The model is used to predict what would have happened had the change not occurred. This is accomplished by applying the calibration factors determined from the previous catalyst as the new catalyst replaces it in the unit. A delta will appear between the predicted and actual dependent process variables and product yields, corresponding directly to the impact of the change. Economics can be applied to the deltas and the value of the change directly quantified.
3. Unit Optimization: Part of the routine technical services we provide is to optimize the current operation against unit constraints to maximize the objective function. We pass along our findings from the process simulators as suggested actions for our customers pursue.
4. Post-Audit/Side-by-Side Analysis: This is similar to unit monitoring but performed after the change is complete. We project time periods, both before and after the change, back to a consistent basis. This allows us to measure the impact of the change and evaluate it economically versus the initial projections.
Albemarle views FCC simulators as very powerful tools for assisting with routine performance monitoring and optimization. When coupled with our other technical service tools (such as equilibrium catalyst and fines analysis, equilibrium catalyst performance testing, and our extensive technical service knowledge and experience base), they help Albemarle provide best-in-class, high value-added technical support to our customers.