Question 88: What is the variation in fresh catalyst chemical and physical properties for your refineries? How do you determine acceptable tolerances for your fresh catalyst quality control?
AVERY (Albemarle Corporation)
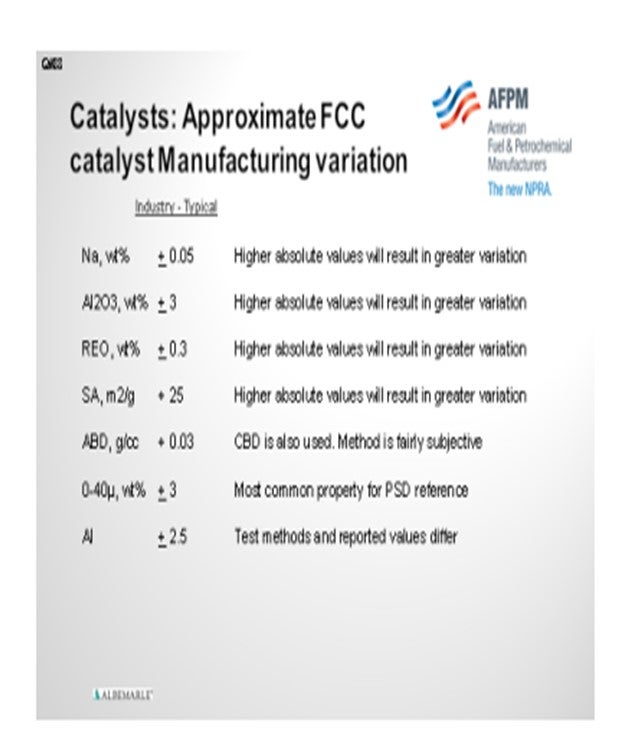
There are large numbers of chemical and physical properties that can be measured. I am really just going to focus on the ones that are most typical. First of all, in the metals’ category will be the sodium, alumina, and rare earth. As you know, rare earth is not a compound; it is a group of elements in the Periodic Table. The most common would be lanthanum, cerium, praseodymium, and neodymium, but there are others that have been measured and/or reported. We use XRF (X-ray fluorescence) to measure those components. Other properties that people will look at and monitor on a regular basis are surface area, apparent bulk density, and particle size: either zero to 20 or zero and 40. Average particle size is around 80+. Also, physical testing, such as attrition resistance, is very common. This plot shows typical standard levels in manufacturing variation.
Every FCC unit can have an area of greater concern. For example, a large inventory FCC requires more fines to circulate properly. One FCC unit design may require a certain attrition resistance. More recently, many refiners have been focusing on rare earth variation due to associated surcharges. Consult your corporate group or catalyst supplier regarding the areas where your unit needs tighter specifications.
BROOKS (BP Refining)
At BP, we are cognizant of the fact that vendors have different manufacturing controls and tend to have control ranges for the catalyst. We also understand that these can vary somewhat between vendors. At BP, we typically use the vendor’s supply of fresh catalyst manufacturing ranges. We will check those against catalyst parameters that could cause issues on our units to make sure that variation ranges are still within acceptable operability for us. We are comfortable with the fresh catalyst properties varying in those ranges.
We will periodically review compiled Certificate of Analysis data that we receive for the shipments, and we will track some of the properties to see if we have gone off-spec. We do not typically go all the way off-spec, but we will use this data as the beginning of a discussion if we start to see a parameter that is or could cause issues.
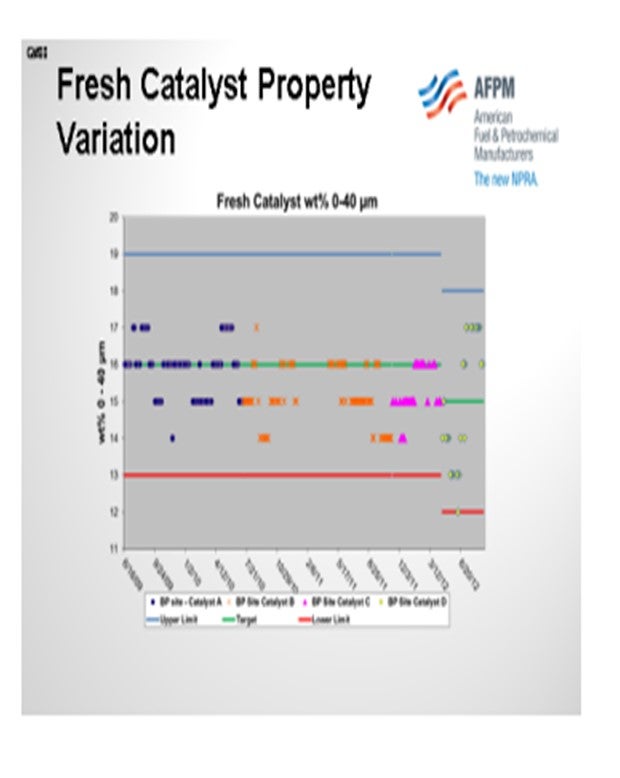
In the past, we have used some of these data to have discussions with our vendors about certain properties. What you see on the slide is one example. At first you might say, “My, that is a high percentage for zero to 40.” But this is on a unit that has a very long standpipe, so it actually helps our circulation. The blue lines on the slide represent the upper specification limits we got from the vendor; the red line shows the lower limits; and, the target is shown in green. We compiled all of the Certificates of Analysis data for the zero to 40, which we would do for other properties also.
We started to notice that the samples tended to trend on the bottom of the specification range, as opposed to the middle. So the request we made was, “Is there any way you can look at your manufacturing to bring us back up near the middle of the range instead of the bottom?” You can see that we changed catalyst formulations because the site and vendor were both able to do that. There is now more variation across the targets rather than at all of the points concentrating below the target line. That is typically what we look at when reviewing fresh catalyst property data and tracking from the vendors.
You can also track your e-cat property data. For certain properties, you may be able to see a starting indication of issues that could be caused by your fresh catalyst. For examples like those that Cliff mentioned regarding tracking your rare earth, you should be able to see reasonable responses in your e-cat that follow what you are getting from your fresh catalyst.
MICHAEL TEDERS (Valero Energy Corporation)
Halle, you said you look at the rare earth content for the fresh catalyst. Have you ever done your own independent analysis for that fresh catalyst to understand if you are really getting what you are buying?
BROOKS (BP Refining)
We have had third parties look at it on occasion, but we do not do that on a regular basis. It is more of a situation that we start to see a problem on some of the data or a property that does not look right, like being unable to find the rare earth we think is supposed to be there. Then we will take it to the third-party.
MICHAEL GRECZEK (BASF Catalysts LLC)
I agree with Cliff and what he showed. I want to add that I think it is basically a question of specification. Let’s just say you have a fresh catalyst surface area specification of 280 m2 /g (meters square per gram) minimum, a 300 m2 /g target, a 320 m2 /g maximum, and also a rare earth specification of 1.8 wt% minimum, 2.0 wt% target, and 2.2 wt% maximum. These are very typical specifications. If you deliver within those specifications, the delivered fresh catalyst is all in spec. But if you have a catalyst delivered with the minimum surface area and maximum rare earth versus a catalyst delivered with the maximum surface area and minimum rare earth, then I want to make sure everyone knows that these catalysts are catalytically different, although both are “in spec”. You can be in spec, but what you really want to be is around the target. That way you ensure constant catalytic performance. BASF spends a lot of money to make sure we deliver fresh catalysts that are always around the target.
AVERY (Albemarle Corporation)
There are a large number of chemical and physical properties that can be measured on fresh FCC catalyst. I will first answer this question by mentioning the chemical and physical properties most commonly reported. The most common chemical properties are Na, Al2O3 and REO (rare earth oxides). RE, or rare earth, is not an element; but rather, a group of elements. The most common RE elements are La2O3, CeO2, Pr6O11 and Nd2O3, which are the oxides of lanthanum, cerium, praseodymium, and neodymium. The most common physical properties are surface area (SA), apparent bulk density (ABD), particle size distribution [PSD, 0 to 40 and APS (average particle size)], and attrition index (AI). The specifications of these properties are a balance between the catalyst plant capabilities and the FCCU requirements. A common two-sigma variation is represented in the slide.
Every FCCU can have an area where there is greater concern. As an example, a large inventory FCCU may require more fines to circulate properly; a certain FCCU design may require a certain attrition resistance. More recently, many refineries are focusing on the REO variation due to associated surcharges. Consult with your corporate group or a catalyst supplier regarding the areas where your unit needs tighter specifications.
BROOKS (BP Refining)
We are cognizant of the limits mentioned before around vendor manufacturing controls and also note the control ranges for different vendors can vary somewhat. Since the individual vendors know their ability to meet certain parameters in the fresh catalyst, BP typically uses the vendor supplied fresh catalyst formulation specifications to determine an acceptable range of variation for received catalyst properties. In each case, the limits provided by the vendor are reviewed to assure that the stated variability will not significantly impact the performance of the unit if the fresh catalyst properties move between the given limits. We periodically review compiled certificate of analysis data on received shipments to determine if the product is meeting the base specifications. It is important to note when reviewing this data that the variation in certain fresh catalyst properties, such as volatiles, can increase when the vendor moves between manufacturing plants or becomes capacity limited. We have also used statistical process control rules on this data to watch for trends consistently above or below the target property value, even if they are inside the specification range. Based on these analyses, we have made requests of our vendors to target tighter property specifications if necessary.
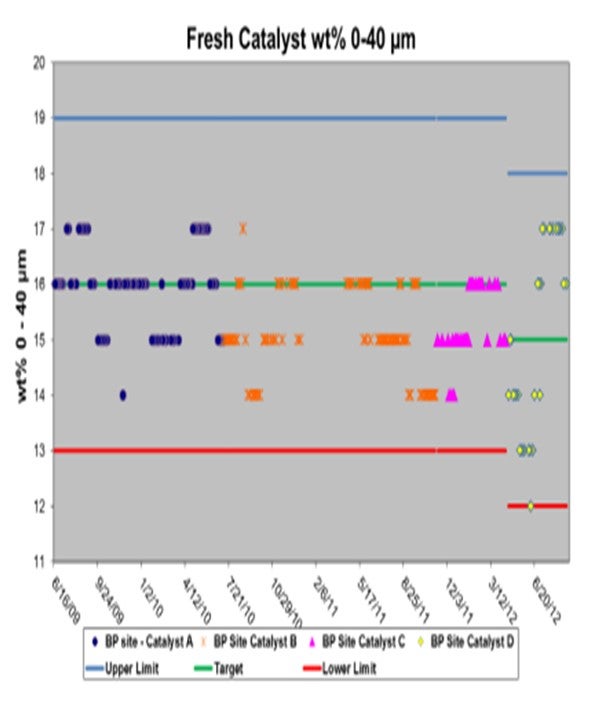
This is an example of a review graph we have used for fresh catalyst data. In this example, we noticed that the fresh catalyst wt% 0 to 40 micron was trending regularly within the upper and lower manufacturing limits, around the specified target of 16. However, it was noted that we were receiving shipments of Catalyst B and C that were typically trending on the low end of the target range. Since this is a critical property for this unit due to circulation limits, we made a request that the vendor look into their manufacturing process to see if they could shift the property back toward center. As can be seen in the Catalyst D data above, the vendor was able to make slight adjustments to bring the range back to historical patterns, with values both above and below the target.
It is also recommended to consider your fresh catalyst properties when reviewing your vendor e-cat sample results. Some shifts in e-cat property trends, such as rare earth levels, can sometimes result from shifts in fresh catalyst quality (among other possible causes).