Question 79: What tools are being used to monitor FCC performance? What are the key performance indicators and expectations?
LALL (UOP, A Honeywell Company)
These are two broad categories for the use of these indicators. The first category is capacity utilization and yield performance, which covers process performance, operating constraints, and optimal use of any inherent design margins. Operating envelopes define the limits of maximum/minimum ranges of key process parameters to avoid potential equipment damage, trigger action, and report it.
Second is reliability and health monitoring by maintaining FCC operating parameters within acceptable equipment limits. Health monitoring is the historical trending of defined parameters, which may or may not be in the operating envelope, to gauge the current condition of the unit health. This monitoring can provide an early warning of availability impacts. Examples are cyclone velocities and slurry ash content. In terms of tools being used to monitor the FCC performance, a customized monitoring tool for the refiner extracts data from the data historian and populates the KPIs (key performance indicators).
UOP’s OpAware™ software is one example of a monitoring tool. We understood the reference to expectations in the last part of the question as asking how you use the benchmarking monitoring in KPI data you gather. For example, a KPI parameter outside the limits of its operating envelope can be automatically flagged by the monitoring tool to generate a report, which is then followed up on by the business team and other parties who are accountable. Examples of KPIs are shown in my Answer Book response.
SCHOEPE (Phillips 66)
The operating envelope on all FCC units within Phillips 66 is framed by safety operating limits and, just recently, reliability operating and environmental limits. In terms of tools, we are using daily, weekly, and monthly tools. The SOLs, ROLs, and DCS (distributed control system) alarms are being communicated directly to the operators. We also get email notifications and offspec lab--notifications; and of course, spreadsheets and live graphic programs. On a weekly basis, most sites do a test run, which means that during that designated day, all of the necessary lab data is taken in order to do a complete material balance. That material balance will then be processed in our FCC simulator. We also check our catalyst properties once a week.
On a monthly basis, we do a catalyst fines analysis on the slurry and flue gas on the catalyst site. The fines analysis will tell you the state of your cyclone and can also alert you to any attrition sources present in your unit. Management has a standard KPI report which is also rolled out monthly. In addition, almost all sites do a cyanide survey which assesses the corrosion potential in the unit. Some partial-burned units do it quarterly. We also have an FCC health check done by a third-party FCC specialist once per year. The health check focuses on the hydraulic conditions of the units, catalyst densities, and steam distributors, for example.

I listed some KPIs on this slide and also put them in the Answer Book. The expectation is basically to optimize the FCC within the operating envelope of SOLs, ROLs, and environmental limits.

BROOKS (BP Refining)
BP’s KPIs and tools are very similar to what Christian said are being used at Phillips 66 and which I assume are what other companies also employ. I want to add that we have recently started implementing a new web-based monitoring tool. It is more of a consolidation type of tool. Engineers and Operations teams still have to input some of the data.
In general, all of the data coming from our historization software is being pooled from the unit. We can set up standard calculations in the software. It is web-based, so it can be accessed from multiple locations. The software presents a consistent view of your monitoring sheets. That way, when engineers are transitioning, it becomes easier for them to understand and recognize the monitoring tools being used across units and spot KPIs. Management teams can run reports with the software, and engineers can post limits that can go directly to the Operations team, which can then use these limits for their log books and Rounds data.
This is a new tool for us. Some of our first implementers have had great reviews of its flexibility and functionality. We have only been using a small portion of its capabilities, and we are actually looking into some of the new functionalities that we will be able to employ later.
AVERY (Albemarle Corporation)
From Albemarle’s perspective, FCC performance is centered on evaluating FCC catalyst, hardware, and feed effects. All methods depend on the tools available, the time allowed to evaluate data, and the quality of that data. The most common methods are kinetic modeling, pilot plant testing, side-by-side comparison, and benchmarking to crossplots. Before using these techniques, the refiner should ensure the collection of quality and mass-balanced data that will account for extraneous streams to the FCC and downstream units.
Kinetic models need the most complete set of data to develop a base case. They also require substantial funds to either purchase the model or resources or the expertise to develop such a model. Using kinetic models allows for the correction of feed effect, operating conditions (such as rise of temperature in cat/oil), cutpoint corrections, and catalyst activity effects. Running the model to seasonal constraints is key to getting realistic output. Results are most reliable when looking at conditions with historical ranges. This method is commonly used to measure FCC catalyst hardware changes. I have an example of the kinetic modeling when we talk about the severe hydrotreating case.
Small scale testing, shown on the slide, is a method that can remove the feed and operating conditions. Ideally, the refiners use e-cat (equilibrium catalyst) data that should be at least 90% changed-out when they look at it. The way you look at this data is very important. You can either look at ISO conversion or ISO coke. In this particular example, you will see several catalysts reviewed. Looking at a constant conversion, you can see that the green catalyst, or Catalyst E, has the lowest amount of coke for conversion. But if you are looking at ISO conversion, then the blue catalyst, which is Catalyst A, is the best catalyst. So, when looking at ISO conversion or ISO coke, your constraints are probably the most important.

Benchmarking through cross plots is a common method. There is no need to look at outside models and testing labs. Results can compare catalyst, heating unit, and hardware changes. Care needs to be taken to plot yields versus their dependent variables. Examples are conversion versus feed basic nitrogen and conversion versus cat/oil. I have two examples.
In the first example, you will see the AI (attrition index) on the X axis, which is accessibility. It is a measurement of large molecules going in and out of the catalyst. You also have light cycle-to-bottoms ratio. You can see that a higher accessibility catalyst will give you a better LCO (light cycle oil)-to-slurry ratio. So once again, you need dependent variables when you plot them.

Another example shows two different catalysts: Catalyst A and the old catalyst. We plotted gasoline yield versus conversion. You can see that one has superior gasoline selectivity.

NAVEEN DIMRI (Reliance Industries Limited)
What is the KPI for the reactor cyclone velocity, and what is the basis? Is it similar to a regen cyclone? Under the reliability KPI, do you want it with the reactor cycle and velocities?
SCHOEPE (Phillips 66)
For the reactor cyclone, the velocities are managed as part of the ROL system. It depends on the kind of reactor system. The ROL for direct-connect riser cyclones is typically 65 fps (feet per second). If you have some sort of a primary disengaging device, then the secondary cyclone will limit this cyclone velocity. For a secondary cyclone, the maximum sustainable cyclone inlet velocity is about 75 fps, although it is highly unit-specific.
NAVEEN DIMRI (Reliance Industries Limited)
What is the life you achieve with that 75 fps? Is it a based on the reliability of the unit? What is the run-length of the operation: four, five, or six years.
SCHOEPE (Phillips 66)
Yes, the number of years varies. We have a question coming up which talks about cyclone lives, so we will cover that a little bit on the regenerator side. On the reactor side, it is anywhere between three and five years.
LALL (UOP, A Honeywell Company)
Key performance indicators (KPIs) define the important FCC unit variables and parameters for monitoring the FCC performance and unit health (also known as “health monitoring”). There are two broad categories for use of these indicators:
1. Capacity utilization and yield performance covering process performance and operating constraints and limits, and optimal use of any inherent design margins.
2. Reliability and health monitoring by maintaining FCC operating parameters within acceptable equipment limits, such as cyclone velocities.
Increasingly, energy targets, process management and safety related KPIs are also being captured in the monitoring tools.
A customized monitoring tool specific for the refiner, extracts data real time from the data historian and populates the KPIs. UOP’s OpAwareTM monitoring system is an example of a monitoring tool encompassing all of the above categories in one unit monitoring tool.
Operating envelopes define the limits of maximum and minimum ranges of key process parameters to avoid potential equipment damage and to trigger action and reporting. Health monitoring is historical trending of defined parameters (which may or may not be in the operating envelope) to gauge the current condition of the unit ‘health’ which can provide an early warning of availability impacts.
We have understood the reference to “expectations” in the last part of the question as asking how you can use the benchmarking, monitoring and KPI information you gather. For example, a KPI parameter outside the limits of its operating envelope can be automatically flagged by the monitoring tool to generate a report, which is then followed up by the accountable business unit team, refinery management and/or corporate management personnel, and the corporate FCC subject matter expert. These reports also permit missed opportunities to be quantified and enable discussion of key missed opportunities across all levels of the organization, facilitating decisions on prioritizing resources, maintenance and improvement projects.
Generally, FCC engineers, operations and advanced process control systems drive the FCC unit to achieve effective utilization of the available equipment design margins up to safe operating constraints and limitations. The following are proposed operating items for which key process performance and health monitoring parameters can be defined. It is recommended for your specific unit design; the target and actual values should be routinely reviewed to improve unit reliability predictions.


SCHOEPE (Phillips 66)
The operational envelop of FCC units at Phillips 66 sites is framed by the Safety Operating Limits (SOL), environmental limits and Reliability Operating Limits (ROL). Within these limits, the FCC is optimized according to economic targets set by the Planning/Optimization department.
Daily tools:
• SOLs and environmental limits are monitored through alarms from the distributed control system. These alarms trigger pre-determent action from the board operator, the shift supervisor, the process engineer and the inspection department.
• ROLs and off-spec lab results are communicated to operations and technical service through email notifications.
• Planning/optimization targets are often communicated through the intranet.
• Daily unit monitoring is done by using spreadsheets or live graphical programs.
Weekly tools:
FCC optimization is done by using FCC simulators based on data from weekly Operating data and catalyst property data supplied by the catalyst venders.
Monthly tools:
• The size distribution of catalyst fines in slurry oil and/or the flue gas fines collection equipment (ESP fines or flue gas scrubber circulating water) is done to identify catalyst attrition sources and/or cyclone damage. This data is typically supplied by the catalyst vender.
• Standard FCC performance reports are issued for upper management with focus on catalyst retention, mass balance quality and slurry exchanger performance.
• Cyclone life calculations are done to assess the remaining life of the regenerator cyclones (See Question 19).
Quarterly to yearly, cyanide surveys are done to assess changes in corrosion potential in the hydrocarbon recovery section.
A yearly FCC health check is often done by a third-party FCC consultant. This check includes a detailed evaluation of the catalyst hydraulics, an evaluation of all gas distributors etc.
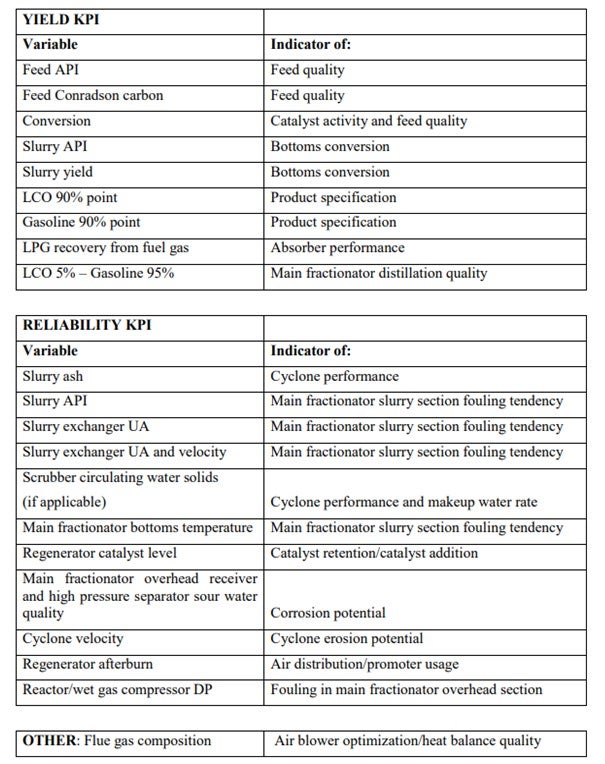
The key performance indicators (KPIs) differ, depending onsite specific Optimization targets, site specific unit constrains and hardware limitations. The table below lists some common FCC KPIs.
BROOKS (BP Refining)
Similar to the other operating companies, at BP we use our internal FCC process model and excel based tools to monitor our units. We also use data historizing software to pull and store large amounts of data out of our plant instrumentation system. Our Excel based tools pull laboratory data and data from the historizing software to feed into our process monitoring calculations.
Additionally, we are currently implementing a web-based monitoring tool across our sites. This tool can be accessed from multiple locations via the web and is meant to streamline the unit health monitoring process. It can be set up with standard calculations for data conditioning, mass balance reconciliation, and process specific KPIs. It pulls data directly from our data historizing system and laboratory data system. The presentation of the data is standardized so that process engineers transitioning from other units are used to the data presentation formatting. Management can run specific reports regularly via the software to track items of interest. Engineers can adjust operating targets online. The tool had functionality to allow for storage of operator logs and Rounds data. First implementers of this new tool have been pleased with its flexibility and functionality. We are still working on implementing it at additional sites. We are also not currently using all the tool’s capabilities fully and plan to explore additional functions in the future.
AVERY (Albemarle Corporation)
From Albemarle’s perspective, FCC performance is centered on evaluating FCC catalyst, hardware, and feed effects. All methods depend on the tools available, the time allowed to evaluate, and the quality of data. Most common methods are kinetic modeling, pilot plant testing, side-by-side comparison and benchmarking through crossplots. Before utilizing these techniques, the refiner should assure that they are collecting quality mass balanced data that accounts for extraneous streams to the FCCU and downstream units.
Kinetic models need the most complete set of data to develop a calibrated base case. They also need substantial funds to either purchase a model or resources, and expertise to develop such a model. Using kinetic models allows for correction of feed effects, operating conditions (such as riser temperature and cat/oil, etc.), cutpoint corrections, and catalyst activity (FST). Running the model to seasonal constraints is key to getting a realistic output. Results are most reliable when looking at conditions within historical ranges. This method is commonly used to measure FCC catalyst and hardware changes.
Small scale testing is a method that can remove feed and operating condition changes. Ideally, the refiner should use e-cat from the unit when the circulating inventory is at least 90% changed out for post-trial audits. Using the feed from the unit is a must. The refiner can review results at ISO conversion, ISO coke, or a condition that is determined to be the constraint. This method will not reveal the accessibility and stripability benefits/changes.
Benchmarking through cross plots is a common method. There is no need to use outside models and testing labs. Results can compare catalyst, feed, and unit hardware changes. Care needs to be taken to plot the yields versus their dependent conditions. Examples are conversion versus feed basic nitrogen, conversion versus cat/oil, etc. Results are not at unit constraints and do not account for feed nor conditions outside the plotted relationships.
SUBHASH SINGHAL (Kuwait National Petroleum Company)
Gasoline barrels and LPG (liquefied petroleum gas) yields are two main KPIs for FCC performance. Catalyst loss and FCC cycle length are additional KPIs for the FCC units, depending on their design.
ROSANN SCHILLER (Grace Catalysts Technologies)
There are many tools that are available to monitor FCC unit performance. Most FCC operators monitor in-process or “as produced” yields and operating conditions; additionally, they complete unit mass balances at routine intervals (often weekly or more frequently).
Of primary importance is the net product value produced by running the FCC. This is most often examined using mass balanced data from the unit, in conjunction with refinery specific product and feed values (pricing). In many refineries, FCC profitability is driven by overall volume gain, so this is an important KPI.
Unit reliability is also a very important profitability parameter, and (along with a strong routine maintenance program), many refiners monitor in process operating parameters to ensure that limits are not being exceeded. Some of these parameters are directly measured in the unit, and some are calculated using in-process or mass balanced data.
Measured parameters include unit temperatures (at various points in the unit, including reactor outlet, regenerator bed, reactor and regenerator dilute phases, and others), unit pressures (reactor and regenerator), wet gas compressor suction and power, regenerator emissions, and slide valve/standpipe differential pressures.
Calculated parameters which are important to monitor include yield selectivity's (yields/conversion), coke make, superficial velocities (especially in cyclones), and catalyst circulation (or cat-to-oil ratio).
The recommended ranges for all of these parameters are specific to the FCC unit’s configuration, feed and catalyst type, and operating strategy.
As a routine service to its customers, Grace provides routine technical service reports, including equilibrium catalyst analysis. These reports can be a critical tool to monitor FCC unit performance, and to troubleshoot the various problems that can arise in typical FCC unit operation. They are most effectively used when they are incorporated into routine operating reviews with the catalyst supplier. During the reviews, recommendations are often made to adjust operating strategies or fresh catalyst formulation to address future operations or issues that are expected/anticipated for the refinery. These routine reviews are a critical component of the successful operation of the FCC.
The catalyst KPIs (key performance indicators) include cracking data [ACE or MAT (advanced cracking evaluation or micro activity test)], physical properties of the catalyst, and chemical analysis of the catalyst. As with yield and operating KPIs, the expectation for these KPIs varies greatly depending on the feed processed, unit design, catalyst type, and operating strategy of the refinery.
In addition, equilibrium catalyst data can be used to benchmark unit performance against similar units, feed types, catalyst types, or a number of other variables. Advanced analytical tool and methods have been developed by catalyst suppliers to understand how age distribution, cyclone performance, contaminant metals, and other variables may impact the performance of the FCC catalyst. These analyses are typically performed “on request” as problems arise.