Question 53: What factors contribute to stack opacity? What options do you use for reducing stack opacity?
FEDERSPIEL (W.R. Grace & Co.)
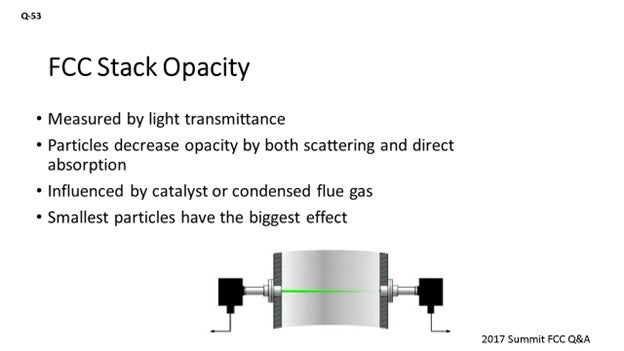
Stack capacity is effectively a measurement of how much light is being blocked by whatever you are emitting out of your FCC stack. The particles that decrease opacity do so by either scattering the light or through direct absorption. Typically, those particles can either be FCC catalyst fines or condensed flue gas. My answer will focus primarily on those FCC catalyst fines/particles that get away from you and out of the stack. Because of the nature of absorption and scattering of light, the smallest particles in that 0.4-to-0.7-micron range – because they are similar to the wavelength of light – have the greatest impact on opacity. So, we look at those smaller fines.
The way that we lose fines out of the FCC is really a marriage of the mechanical design, the way you are operating the process, and the specific catalyst you choose to put in. When you purchase your catalyst, it does contain some smaller fines particles. But typically, 1 or 2% of the inventory that the cyclones cannot retain will typically be lost to the stack. Fines you are generating in the unit also lead to stack losses. Several mechanisms could be contributing to that generation of fines. Then, there is the issue of how you operate the unit, in terms of how much catalyst you are driving to the cyclones. If you change your level up too high, you can certainly load your cyclones quite a bit more, although the efficiency might drop. Changing your velocity will certainly also have an impact. There are some additional details on the slide that show how the actual particle properties impact opacity.

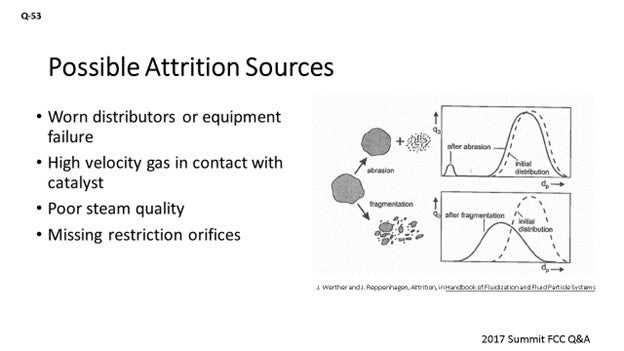
Within the fines generation piece of that puzzle, we can see different ways that the catalyst attrits. One of the mechanisms for attrition and formation of fines is the fractuating of catalyst particles where a particle breaks up into several larger particles. Abrasion is another mechanism. Abrasion is where the surface of the catalyst abrades off, leaving largely the original catalyst particle intact but forming a lot of the microfines, which are particularly bad for opacity. So, there are quite a number of possible attrition sources throughout the FCC. Some of these are inherent in just the operation or design of the catalyst in circulation, but we can certainly make changes that will worsen an existing problem.
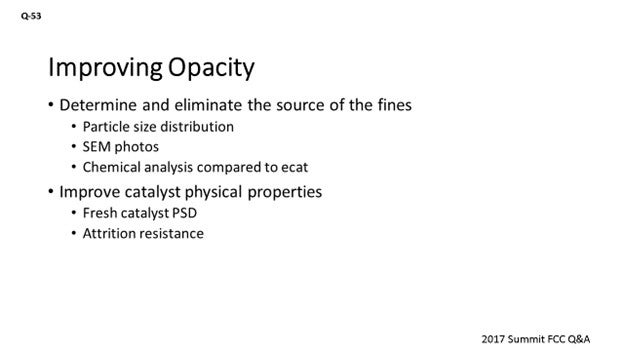
If we are looking to improve opacity, we could determine and eliminate that source of fines generation by using one of several available analytical methods to help us identify their origin within the unit. Are we seeing fracturing of particles or more abrasion of particles? We can use SEM (scanning electron microscopy) analysis, which can give you an idea of the shape of the particles. Certainly, looking at the particle size distribution analysis of both the e-cat (equilibrium catalyst) and the fines will give you really good clues. Lastly, examining the chemical analysis and comparing it to the e-cat will really show whether you are concentrating the fines up in surface contaminants.
Using those analytical methods, we can – hopefully – narrow down the possible causes of where we might be seeing attrition, like whether there is a high jet velocity somewhere in the unit that we might need to go investigate. Clearly, to mitigate the attrition, you can also improve your catalyst’s physical property. So, if you put a more attrition-resistant catalyst into your unit, you will expect to generate less fines. Certainly, shifting the fresh catalyst particle size distribution is another way you can help improve opacity. If you knew you had a cyclone loss issue and decided to shift the fresh catalyst particle size to a little coarser grade to avoid the small particles from being lost and recorded as opacity, then you can certainly do that.
TRAGESSER (KBR)
Mike covered attrition well, so I will not go over the information on this slide.
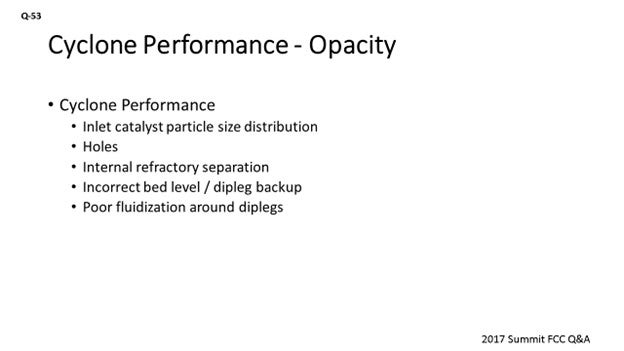
Cyclone performance is probably one of the primary factors that impacts opacity. There are a number of problems that can lead to reduced cyclone performance such as holes, incorrect regenerator bed level, or excessive cyclone velocity that can increase attrition and may also result in excessive catalyst backup in the dipleg. Refractory peeling away from base steel can lead to a catalyst loss problem. Air distribution problems in the regenerator can lead to a dipleg that is trying to discharge into a defluidized region of the bed.
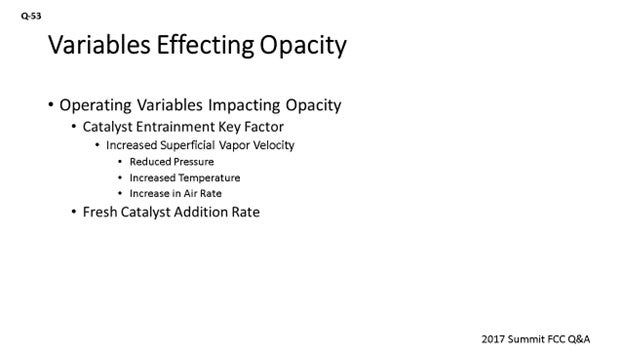
Catalyst entrainment to cyclones also directly impacts the catalyst loss through the cyclones, and the major variable that impacts entrainment is the velocity in the regenerator. So, anytime the air rate is increased, the catalyst loading to the cyclones is increased, thereby increasing losses.
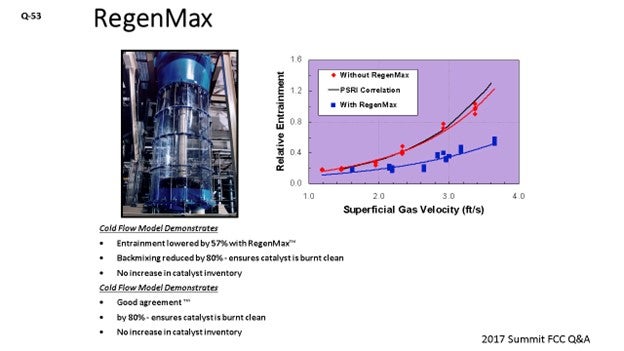
KBR has a technology called RegenMax™ that reduces entrainment by about 50% for a given superficial velocity. This technology consists of a small layer of packing that is placed in the middle of the regenerator bed, which breaks up large bubbles that are formed as gas rises in the regenerator bed.
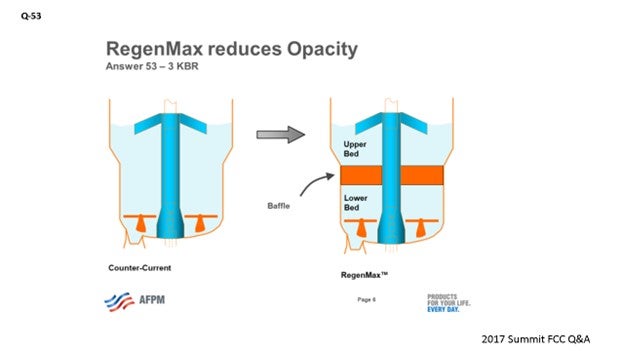
As with many inventions, this feature was actually a side benefit that was discovered during the development of RegenMax™. The primary purpose was to create a two-stage regeneration effect in a single-regeneration vessel by reducing the catalyst backmixing. I will talk about that effect more later.
DINKEL [Marathon Petroleum Corporation (MPC)]
I will just add a couple points from our experience. Over the past few years, we have utilized O2 enrichment, which supports the points the other panelists were making about reducing superficial velocity and entrainment. We have effectively used O2 enrichment as a handle to extend runtime and attempt to get ourselves closer to a plant turnaround cycle.
To add to Mike’s point about catalyst particles, we have also used the technique of classifying spent catalyst into a heart-cut on a unit with high losses to get rid of both the fines and the coarse particles, as well as to help improve the fluidization properties.
WARREN LETZSCH (TechnipFMC Process Technology)
When we talk about opacity, I can remember when 40 was a good number. Obviously, we were looking at a lot of catalyst going out the regenerator stack. And then, the rules got more and more stringent. When you guys get down to opacities of 3, 4, or 5 numbers like that, what is really the percentage of catalyst? How much of that is ammonium sulfate or something in the stack that is considered a particulate now because of the EPA (Environmental Protection Agency) measurements that you have to take into consideration? My point is that there is a limit of where you can probably go, as far as opacity, and it will not have anything to do with catalyst anymore. Let me ask you in a different way: If you know your opacities, do you know what percentage of it is catalyst and what percentage is other solids?
RIK MILLER (Phillips 66)
We have done some studies in units that use wet gas scrubbers (WGS) to remove SOx (sulfur oxide) and particulates from the flue gas stream. In those units, as much as 50% of the particulates in the stack were not actually catalyst. They were sulfates that were entrained from the wet gas scrubber. We found that the number of sulfates in the flue gas was proportional to the total dissolved solids in the circulating scrubber solution. I do not think there is much ammonium sulfate in the flue gas from a unit with an electrostatic precipitator (ESP) or a third-stage separator (TSS).
NIK LARSEN (Marathon Petroleum Company)
One aspect we might take for granted is actually making sure the opacity reading is real. So, chasing down issues like this, if you are chasing excess stack opacity, one of the things you might take for granted is the opacity analyzer is actually installed per your manufacturer’s guidelines. Right? So, how the analyzer is purged and with what media and making sure it is inserted properly can make a difference in your opacity readings, so they need to be checked if you are chasing down the excess stack opacity event.
RIK MILLER (Phillips 66)
At one of our refineries that operates with a TSS as its primary particulate removal equipment, we did a trial where we had the fresh catalyst classified to remove most of the 0–40-micron material. We had an outside vendor remove the 0-40 from about 12% down to 3%. Our stack opacity was cut by more than half – from 20 down to 8 – by removing most of the 0-40 from the fresh catalyst.
PAUL DIDDAMS (Johnson Matthey)
One additional thought to consider, if you have an ESP, is that the ESP’s efficiency may be impacted by ultra-low SOx levels. So, if you control your SOx levels to less than about 20 parts per million, you can end up with insufficient ionisable polar molecules and lose ESP efficiency. However, this efficiency can usually be recovered by re-optimizing the amount of ammonia used in the ESP. However, if the ESP efficiency is allowed to go down as a consequence of going to very low SOx levels, then catalyst losses will increase. This is another potential cause of increased opacity.
MICHAEL FEDERSPIEL (W.R. Grace & Co.)
Opacity measurements are influenced by particle density, particle refractive index, particle size distribution and particle color/composition. In this system, particles present are typically either catalyst particles which are not retained in the FCC, or condensed particulates from the combustion products that form due to local conditions. Particles decrease light transmission by both scattering and direct absorption. Particles with diameters approximately equal to the wavelength of visible light (0.4 to 0.7 µm) have the greatest light scattering effect and give the highest opacity1.
Stack opacity is primarily a function of the quantity and quality of the catalyst losses from the regenerator. Factors that influence catalyst losses (and stack opacity) include cyclone performance, the amount of catalyst entrained to each cyclone, fresh catalyst fines added, and fines that are generated in the operation of the FCC. Cyclone performance (including third-stage separators) is dictated by mechanical design and the physical condition of the cyclones, as well as unit operating conditions which include regenerator level, the actual air rate versus design, and the transport disengaging height in relation to the cyclone inlet. Unit operation also plays a part, along with catalyst properties, in the entrainment to the cyclones. While the fines added to the FCC are solely due to the fresh catalyst and additive particle size distribution, the fines that are generated are a function of the fresh catalyst and additives properties, the unit operations, and the mechanical design and condition of the equipment.
Fine catalyst particles (0-20 µm) are the most important variable in stack opacity. They are the fraction most easily entrained to the cyclones and most easily lost by the cyclones (Figure 1). They are formed during catalyst manufacture, from abrasion during in-unit circulation, and from fracture during in-unit circulation. Microfines less than 2 microns in size are of particular concern.
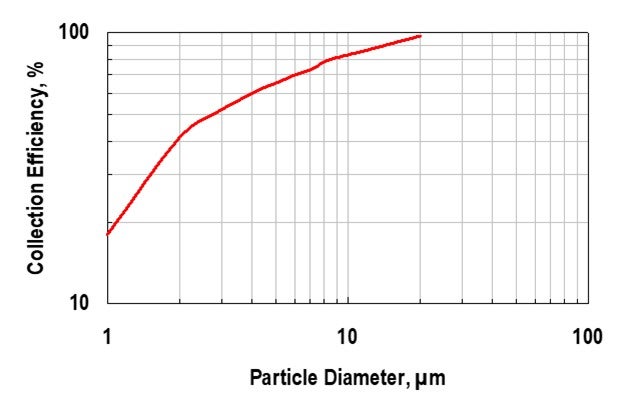
Figure 1. Cyclone Collection Efficiency2
There are several possible sources of attrition through the reactor/regenerator system:
-
A hole in the air grid or eroded nozzles,
-
Excessive dense bed velocity due to high air rate or low pressure,
-
Excessive cyclone inlet velocity,
-
High torch oil nozzle steam purge rate,
-
Steam condensate contacting the catalyst,
-
A tube leak in the catalyst cooler,
-
Excessive catalyst cooler fluidization medium,
-
Eroded or missing restriction orifices,
-
A hole in the stripper grid or steam ring,
-
A hole in the reactor dome steam line,
-
Wet stripping steam,
-
Open blast points or excessive aeration air or steam to standpipes,
-
Excessive lift media rates,
-
High instrument tap purge rate, and/or
-
Attrition in the catalyst loading lines because of excessive velocity, long distance, or tortuous path.
While excessive feed nozzle velocity – due to high steam rates or plugged nozzles – usually leads to a sharp increase in 1-micron slurry fines, some fines may make their way out of the regenerator and increase opacity.
There are a few methods available to determine the attrition mechanism for a catalyst or additive. Scanning electron microscopy (SEM) images of both the fines and the e-cat show the size and shape of the catalyst particles. The particle size distribution of the fines and e-cat can also provide some insight (Figure 2).

Figure 2. Particle Size Distribution of Different Attrition Mechanisms
Comparing the elemental analysis of the fines and e-cat can show whether the fines are concentrated in typical surface contaminants (nickel and iron), which could indicate abrasion as the attrition mechanism.
Catalyst type also affects attrition and opacity. The catalyst formulation, binder technology, and overall catalyst manufacturing process are all important factors in FCC catalyst attrition and stack opacity. Additionally, the morphology of the catalyst particle also plays a role because irregular particles are more likely to undergo attrition than uniform spherical particles (Figure 3).

Figure 3. Morphology of FCC Catalyst of the Same Chemical Composition:
Sample 97-G on the left was twice as attritable as sample 97-R.4
By using catalyst and additives with better attrition resistance, stack opacity can be improved by reducing the generation of fines in the FCC unit. Eliminating attrition sources in the FCC unit, using the list above as a guideline, will also improve stack opacity, especially since the smaller fines generated through catalyst attrition have the greatest impact on opacity. Quickly repairing damage to cyclones and third-stage separators will eliminate high losses of larger particles from the FCC. Finally, by operating the FCC within design conditions, the risks of mechanical failure in the cyclones and velocity induced attrition are minimized.
BRYAN DINKEL [Marathon Petroleum Corporation (MPC)]
Opacity measurements can be impacted by steam, solids loading, or shifts in particle size of the solids to the stack. It is important to note that there is not a valid correlation between opacity and particulate matter (PM). Figure 53-1 illustrates that at the same opacity reading, there can be different PM rates due to the impact of particle size distribution (PSD) on the opacity analyzer’s light attenuation. For additional background and discussion on this relationship, refer to Ronald G. McClung’s article entitled, “Effect of FCC Catalyst Density and Attrition Index on Stack Opacity”5.
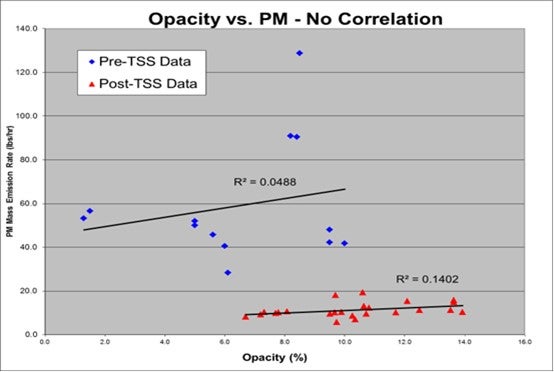
Figure 53-1. MPC Example Illustrating Opacity versus PM Relationship
The options available to reduce flue gas solids and impact stack opacity include modifying regenerator cyclones, installing/redesigning a third-stage separator (TSS) and electrostatic precipitators (ESPs), injecting ammonia to the flue gas upstream of the ESP, installing or modifying the wet gas scrubber, modifying the fresh catalyst particle size distribution to reduce solids losses, and making operational changes to reduce entrainment to the cyclones.
Marathon Petroleum Company has a mix of these control technologies across our system. We have observed positive performance improvements on ESP collection efficiency with the injection of ammonia. The slide below was presented during the 2014 Cat Cracker Seminar entitled: “FCC Environmental Control Technology: Reliability & Operation Discussion.” This slide shows a generic PFD depicting the available environmental controls. Most units will not have all of the components but will have a combination of technologies: cyclones, TSS, ESP, and wet gas scrubber.
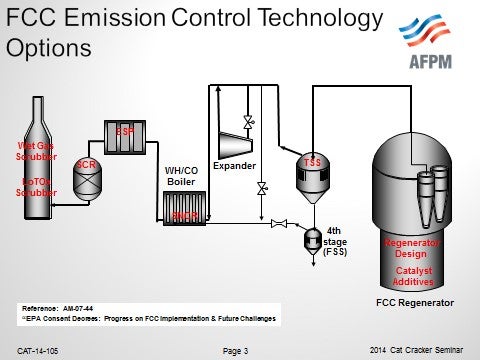
Figure 53-2. FCC Emission Control Technology Options
Regarding catalyst particle size distribution, we have made changes to fresh catalyst to a coarser grade material to aid in managing regenerator side losses. We have also purchased classified spent catalyst to supplement high losses on a unit that was a “heart-cut” material, targeting to minimize both fines and coarse content of the catalyst. Both of these classification options have been successfully implemented as part of solutions to reduce catalyst losses. On the same unit that used classified spent catalyst, we also utilized oxygen enrichment to minimize superficial velocity, minimize entrainment, and reduce catalyst loading to the cyclones.
SCOTT EAGLESON (DuPont Clean Technologies)
FCC regenerator flue gas stack opacity is typically associated with high particulate (catalyst fine) emissions. However, other flue gas constituents can also contribute to stack opacity and flue gas color. These include highly oxidized SOx and NOx (nitrogen oxide) compounds. Nitrogen dioxide (NO2) can appear as a yellow/brown haze. Sulfuric acid mist (H2SO4) can appear as a white/blue haze. Much depends on concentrations, stack diameter, exhaust gas flow rate and temperature, atmospheric conditions, sunlight, and viewing position. DuPont Clean Technologies has provided over 140 FCCU flue gas cleaning systems to minimize stack opacity using BELCO® EDV® Wet Scrubbing and SHELL third-stage separator technologies to meet extremely low particulate NOx and SOx outlets.
YORKLIN YANG (BASF Corporation)
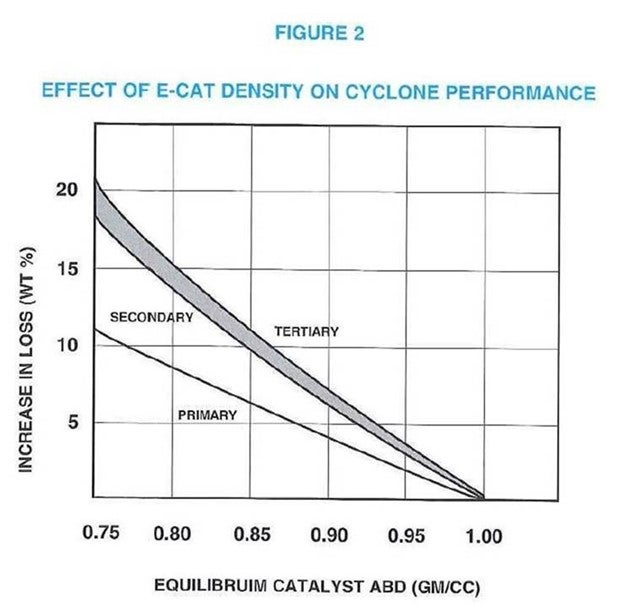
Many factors can contribute to stack opacity. Catalyst physical properties and flue gas system design and operation are two important factors. The catalyst physical properties include:
particle size distribution (PSD), particle density, apparent bulk density (ABD), catalyst attrition index, and catalyst fines PSD distribution in the stack. The chart below shows the effect of catalyst apparent bulk density (ABD) on cyclone performance: the higher the catalyst ABD, the less catalyst lost to the stack.
Below is another chart illustrating the effect of stack fines average particle size (APS) on opacity.
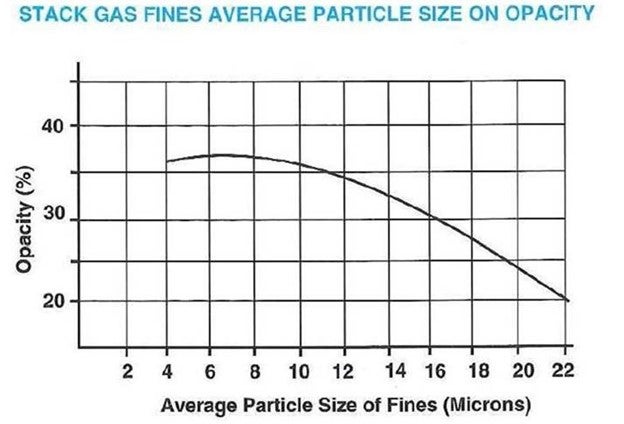
For a significant range of stack fines with average particle sizes of 4 to 11 microns, the capacity changes less than 3%. Above 11 microns, there is a more substantial decline of opacity due to less fine particles. It is found that FCC physical properties affecting opacity in decreasing order of importance are Catalyst Attrition Index, apparent bulk density (ABD), and particle size distributions.
The FCC flue gas system design and operation play important roles in reducing stack opacity. It is important to review operating conditions to check for a significant deviation from normal/original design, for example:
● Sudden vessel pressure loss,
● Regenerator bed de-fluidization due to low air rate, and
● Capacity creep.
Reactor cyclone flooding may be caused by:
● High velocity (higher feed rate, more gas, lower pressure etc.),
● High cat circulation rate, or
● High stripper level.
Regenerator cyclone flooding may be caused by excessive catalyst entrainment to cyclones from bed due to:
● High bed velocity, higher bed level, lower pressure, and lower density catalyst;
● High cyclone velocity (increased air rate, lower pressure, etc.), or
● High regenerator bed level.