Question 44: How do you monitor exchanger fouling? How do you use that information to justify additional work scope during unplanned shutdowns?
GAMBOA-ARIZPE (CITGO Refining & Chemicals, L.P.)
Unplanned shutdowns: In the refining business, we understand the nature of unplanned shutdowns. Despite our best efforts to avoid them, it seems like Murphy’s Law really loves our industry. “Whatever can happen, will happen” is a phrase often attributed to Edward Murphy, an Air Force physicist who uttered the words in response to the failure of devices he was testing that failed to work as designed back in 1948. What most folks do not realize is that the mathematician Augustus De Morgan first published the phrase on June 23, 1866, or about 92 years before Murphy used it. This observation raises the possibility that if something went wrong, is that Murphy is really De Morgan being misremembered.
In a broad sense, every piece of process equipment within a unit has a purpose and a function. However, the functionality of any given process equipment is reduced over time, most likely from fouling. The performance deficiency against ideal conditions can then be calculated and quantified in terms of process impact, which, in turn, can be quantified as lost economic impact. With heat exchangers, such gaps can be readily quantified, assuming that the associated process variables – i.e., temperatures and pressures – are being historized and that they are reasonably representative of the process. In other words, are they accurate?
Using the data from these variables, along with the fluid properties of the associated process streams, provides a basis to calculate the transferred process duty across any given exchanger, the quintessential performance metric which quantifies how efficiently an exchanger is performing versus design when it is clean. The extent of the economic impact of any calculated performance deficiency largely depends on the specific function that heat exchanger is designed to provide.
For example, consider the case where a fouled heat exchanger fails to cool the rundown temperature of a product stream and exceeds the storage specifications of the product tank. Such a limitation could be highly impactful because the product rate and, by proxy, the charge rate to the unit would have to be reduced until the rundown temperature is cooled below the specification. Or, how about a case where available hydraulics on the feed circuit are limiting? Would not such a limitation tend to emphasize the need to minimize exchanger pressure drop which fouling generally affects? There are plenty of unit operations that can be adversely impacted by decreased performance across exchangers. Some are more limiting than others. For this reason, unit process engineers are generally assigned the responsibility of tracking the relevant performance metrics of most or all of the exchangers in their respective process units.
Tools, such as spreadsheets, can be used to quantify the economic impact of lost exchanger performance. These tools can also be employed to predict when the impact of lost exchanger performance will become limiting enough to the organization that the planners are made aware of the need to incorporate the maintenance of the exchangers into the respective plants. If monitored properly, any underperforming exchanger will be identified with enough lead-time to be included in the short- or long-term maintenance plans.
The effect of two-phase flow within exchangers also needs to be understood by those involved with the operation and those monitoring the performance. Phase-dependent considerations are particularly applicable in preheat exchangers where high vapor loads – beyond what was factored into the exchanger’s respective design – can become limiting. The extent of vaporization in a particular exchanger depends on more than just the absolute temperature and pressure of a system at a given point.
The vaporization fraction can depend on:
1. Not-so-subtle changes to the feed slate (or any other change that can cause the fluid properties of the streams to be appreciably different from those used in the design basis, particularly changes to the initial boiling point of a stream or even its water content).
2. The overall flowrate through the exchanger (flow dependent pressure drop both within an exchanger and the interconnecting piping can produce more flashing); and/or,
3. Heat transfer efficiency losses (both from latent energy changes and from lower thermal conductivities in the vapor phase compared to those in the liquid phase).
Because exchangers in a preheat train are usually interconnected, as I just described, the combined effects of these process factors can produce nonsensical situations such as excessively high dP that comes and goes. So, you measure the dP, and see that it is really high. Then you go back and measure it two weeks later, and it is really low. You are scratching your head, thinking: What is going on? It is probably pertinent to look at the vaporization components. It only makes sense, in light of a significant deviation from the two-phase flow bases that were used for a particular exchanger’s design.
A final point to consider is that certain fouling deposits can eventually result in exchanger leaks via highly localized under-deposit corrosion mechanisms. Because unexpected exchanger leaks are more disruptive in the planning sense and fouling base performance gaps alone, the buildup of these types of deposits – such as naphthenic acid salts, ammonium sulfides, ammonium chlorides, etc. – needs to be identified and associated with the relevant processes so that the appropriate risk is also factored into the maintenance planning activities.
THEISS (Marathon Petroleum Corporation)
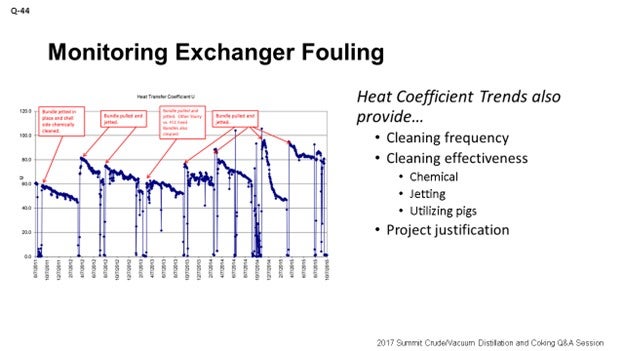
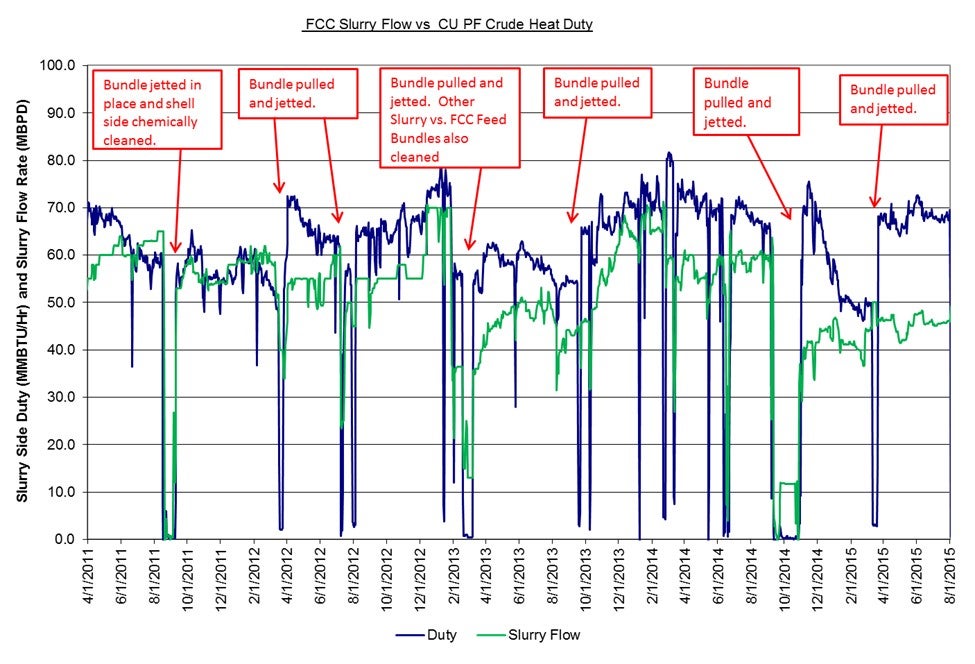
I will just briefly expand upon what Héctor talked about and put it into pictorial form. Monitoring fouling really comes down to good engineering and having good process unit engineers who continue to monitor their data. There are simple spreadsheets or programs available for them to use to do this monitoring. What you see on the slide is an example of a fouling trend which allows you to really provide some insight on developing projects to extend the cleaning cycle, if the economics are there. Potentially establishing a routine frequency at which you are fouling and proactively cleaning exchangers is also an opportunity as long as these processes are being properly monitored. I also want to mention that whether you clean in place, do some sort of online cleaning, pull the bundle, or potentially utilize pigs to clean a bundle, you will see the effectiveness of these different cleaning processes through trending.
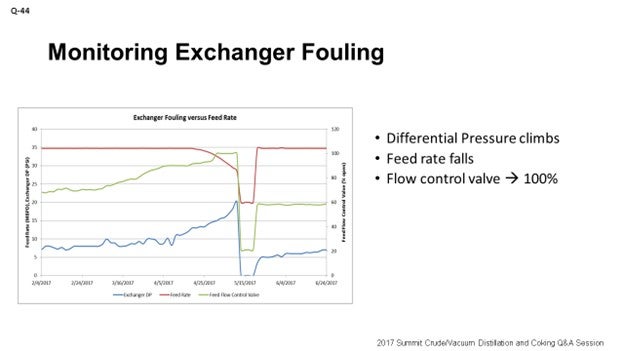
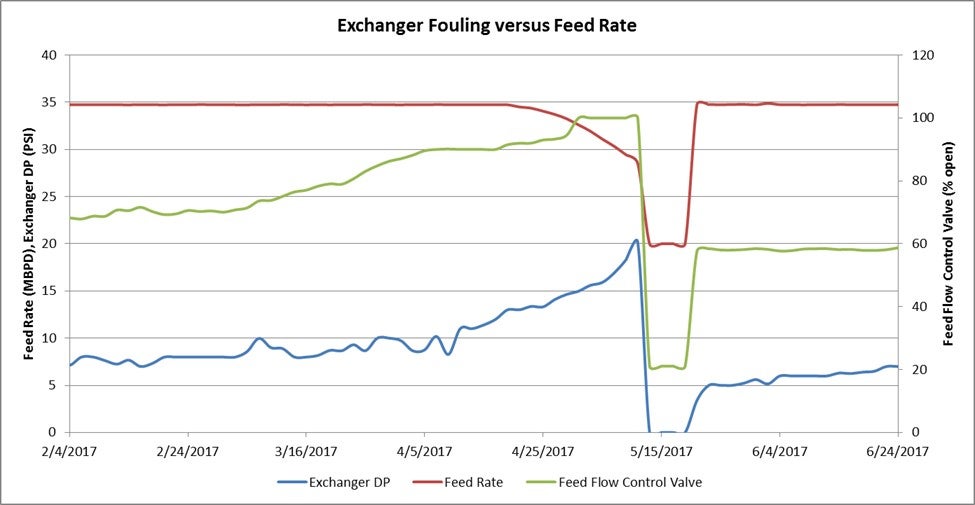
On the next slide, I will go over the other monitoring points. As far as heat exchanger coefficient, it is also important to measure pressure drop. Do some simple trends where you can observe pressure drop over time, translate that to feed rate, and then watch as your flow control valve position responds. The main takeaway is that it is not all about fouling coefficients. There is also pressure drop that could be occurring which demonstrates that it is time to clean your exchanger.
LÉGARÉ (Andeavor Martinez Refinery)
I will add to what Héctor, and Jeremy have said although there is not much left for me to mention. The exchanger performance is really an important part of the unit health monitoring that is done by the unit engineers. The question is: How does that data actually get into the monitoring report? That data does not just magically appear. If you are fortunate, you will have the DCS data from which to generate your trends. But more than likely, this data will be manually gathered on the preheat train of an older crude unit. Make sure you have the right targets identified on inlet and outlet flanges so that the IR (infrared) guns are aiming at the same point every time the data is gathered. It is really important to leverage your operators to gather that data so the engineer can spend time doing his/her analysis. Do not get me wrong. If there are any young engineers in the room, it is important for you to do it at least once yourselves so you understand what the operators are doing for you. This will allow you to respect their time as well.
The data collection should begin right after a turnaround so that you have good start-of-run data. It is important to have that start-of-run baseline as your starting point to measure degradation over time. I cannot stress the point enough that if you want to be successful getting heat exchanger cleanings added to a work list, you need the data and you need to communicate that data to the appropriate audience. If you do not communicate your data and keep it buried in your monitoring report, it will never be seen by the intended audience. So, communicate, and communicate often. Make sure it is in front of the Management team, so they know the degradation that is happening. If there is an opportunity to clean the exchangers, you would not have to start your explanation from the beginning; instead, you can explain to them that you have been monitoring the data for months.
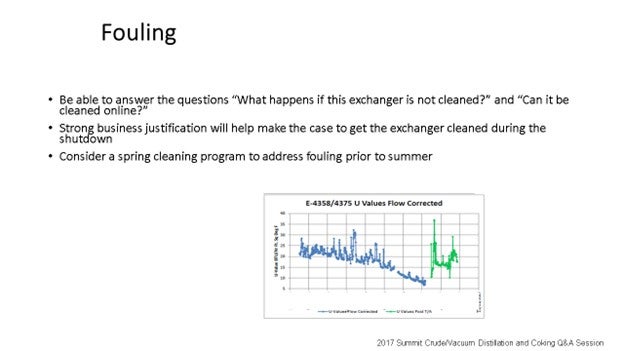
Definitely think about the business case for what you want to add to the work scope. If it is an unplanned event, the TAR planners do not want to add anything unless it is absolutely necessary. Some of the favorite questions we get asked all the time are: “What happens if the exchanger is not cleaned?” and “What is the business impact?” It is best for you to put that in dollars and cents; not just say, “Well, it is better if we clean it.”
Another question is: “Can it be cleaned online?” I cannot tell you how many times I have heard, “Yes, it can be cleaned online.” Then you try to clean it online, and the isolation valves do not hold. You then have to wait for the next shutdown to clean the exchanger. It is important to check the isolation valves to make sure they hold prior to deciding if the work can be done while the unit is online.
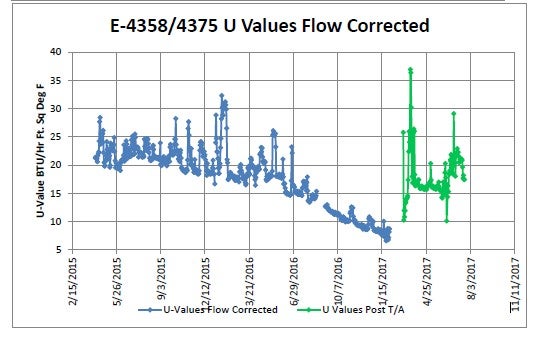
Lastly, consider a spring-cleaning program. Something we do is identify a spring-cleaning list of exchangers that you can go out and clean during the cooler seasons to avoid impacting production rates. Work is also typically done at night; again, to minimize impacts to production and allow us to regain performance as we go into the warmer months. I just tacked on a trend here. It shows you what degradations look like before being cleaned. You can see the spike back up again once the exchanger has been cleaned.
KIP EDGMON (Martin Resource Management Corporation)
We are curious about your frequency. As far as your surveys, what have you found to be effective? Are you talking about collecting that data once a week? Once a month? Once every two months? What do you guys prefer, and what are you using to really see a good trend?
LÉGARÉ (Andeavor Martinez Refinery)
I will say that if we know we have a fouling service, I will go once a week just to get the dataset out there. This frequency gets the operators used to pulling that data on a regular basis. I find that if you go longer than that period, you will run the risk of the data not getting collected. In that case, instead of missing two weeks’ worth of data, you would then be missing two months’ worth of data. So, I would go more frequently rather than less frequently.
DAVE FERGUSON (Tracerco)
I will certainly not dispute anything the panel has said, but I find that the situation is more like Eric said. There are many times when data is not available or people are not getting out to check readings and collect data; so, there are services available, like those offered by Tracerco. We can help you identify how much fouling you have in your exchangers and where it is located, both with tracer and non-tracer techniques. Tracer techniques have been used to determine the total volume of fouling by measuring the residence time and comparing that to the theoretical residence time, based on the volumetric flow. This service has a 5 to 10% error. Non-tracer techniques generally involve the use of a neutron backscatter (NBS) device. This device measures the density of hydrogen atoms (free or in a compound) just inside the vessel wall. For example, a hydrocarbon liquid flowing through the shell side of a horizontal exchanger will have a certain hydrogen density. If there is fouling material laying in the bottom of the shell, it will displace much of the hydrocarbon. The fouling material, even though it is “wet” with the flowing hydrocarbon, will have a different hydrogen density. The interface between the two areas can be measured with the NBS device. These services are available when and where you need them.
THEISS (Marathon Petroleum Corporation)
Just to tackle what Eric said, we probably feel the same, as far as weekly monitoring. In places where you have automated temperature indication, as frequently as possible is recommended to develop good trends. Earlier, we talked about wireless technology. We have utilized that on quite a few of our exchangers to bring in data to the house. It is not really a control point, but it does provide a lot of insight for engineers to develop fouling trends and watch over time. So, wireless technology is a good application that is relatively inexpensive.
DANIEL McGRAW (Marathon Petroleum Corporation)
I want to echo that wireless technology is a great application for collecting fouling data on exchangers, or really any monitoring for that matter. We have used it at my facility in Canton, Ohio. It is a cheap way to get critical information on critical models.
UNIDENTIFIED SPEAKER
Really, I would just like to ask you guys about your wireless to see who you are using and what is working well, because we are looking to doing the same thing: setting up wireless transmitters to avoid going out to collect the data manually. There are a couple of companies out there. So, after the break, can you guys tell us who you are using?
UNIDENTIFIED SPEAKER (CITGO Petroleum Corporation)
My question for the panel and others in the room is: Does anyone have any techniques or success stories that they can share about online or in-situ bundle cleaning?
LÉGARÉ (Andeavor Martinez Refinery)
As far as online cleaning, I talked about a spring-cleaning program. Much of what is in our program are overhead air fin fans, which are done online without any real impact. There are a lot of the exchangers that are pulled, cleaned ex-situ, and then reinstalled. I do not have much to add, as far as in-situ cleaning.
THEISS (Marathon Petroleum Corporation)
We have had some success with some chemical vendors out there, as far as cleaning. They generally do an effective job. Recently, we have been trying a couple of new products and different applications, and they seem to be working well.
JEREMY THEISS (Marathon Petroleum Corporation)
Exchanger monitoring software or spreadsheets that pull in refinery process data can be used to monitor fouling trends. Exchanger trains should be evaluated for fouling on a routine basis to provide historical references and trends to compare pre- and post-cleanings. The definition of routine should take into account the specific exchanger’s impact on the process and the importance of the process unit to the refinery’s profitability. These calculations are necessary to set appropriate cleaning cycles for both planned and unplanned outages.
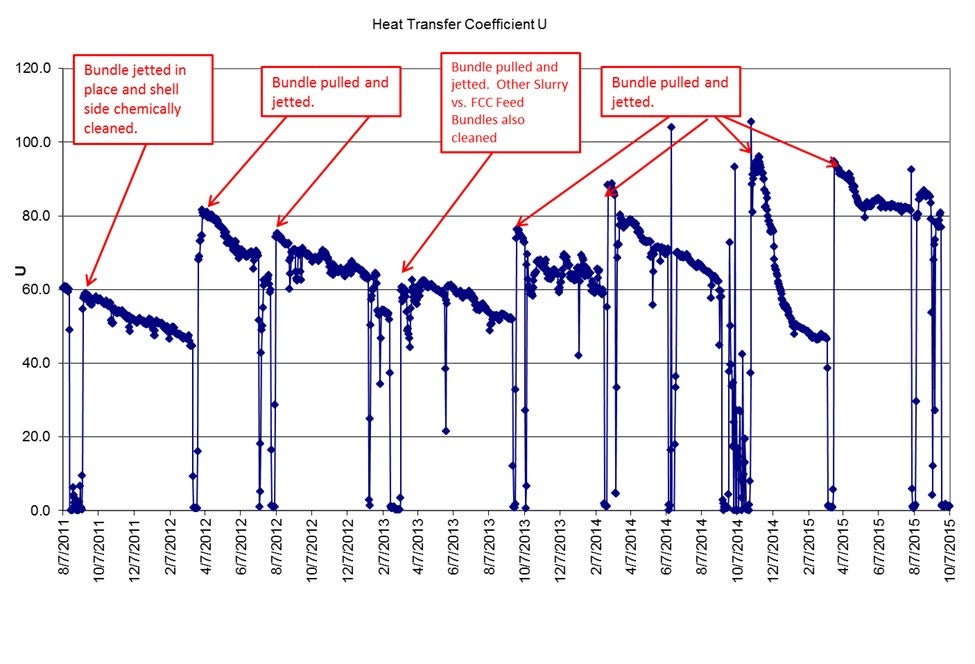
For unplanned outages, an evaluation should take place on the fouled exchanger to determine how much recoverable duty is available and an understanding of the next planned cleaning opportunity. Understanding how the heat transfer impacts unit rate and energy consumption will be essential in determining the economic impact of cleaning the exchanger. The cost of cleaning exchangers is typically small relative to the lost production, if rates have to be held back due to unit limitations. Below are examples of tracking trends used to monitor exchanger duty and heat transfer coefficient. The tracking data allows for post-auditing of cleaning options and the impact of secondary exchangers on the system’s heat balance. In addition to having historical data, having the availability of exchanger design data will provide engineers with more insight on clean operating conditions and design heat transfer coefficients (U).
For opportunistic exchanger cleanings (i.e., when a process unit has reduced rate or has shut down for an unrelated issue), economics are evaluated based on ROI or days to payback. The key points to focus on are estimated cleaning costs, fence line energy savings, and/or throughput increases. Estimating the post-cleaning outlet temperature will allow you to estimate energy savings, subtracting out cleaning costs, and calculate a payback. Estimating a clean outlet temperature can be done based on history or using exchanger design, while understanding unit configuration changes that may have occurred. Any projections?] for throughput increases can be added on to the overall payback while, taking into consideration additional processing costs for those barrels. Once again, if data is collected and analyzed routinely, the engineer will be able to make relatively quick decisions during these opportunistic events.
To ensure that all exchangers are being vetted properly, post-audits are highly encouraged. This [procedure?] allows the engineer to determine the effectiveness of the cleaning and, in some applications, establish a cleaning cycle. Post-audits should include actual energy savings and actual cleaning costs.
If the process unit is hydraulically limited, tracking the exchanger dP over time is critical to determining value lost and gained from cleaning. In the example below, the exchanger dP increased to the point where feed rate was reduced. This reduction in capacity justified a slowdown to clean the exchanger and increase throughput. The justification process is similar to the previous examples of payback periods with the complexity of accounting for lost production for the cleaning period and the increase in production after the cleaning period.
Depending on the service and design of the exchanger, the type of cleaning may impact your decision. Conventional water-lancing will mostly clean straight sections of the tube, while the U-bends may remain dirty. In some instances, this lack of thoroughness could leave about 20% of exchanger area with foulant. Chemical cleanings may also provide heat exchange recovery with minimal lost opportunity. These chemical cleanings may provide a cheaper alternative to the traditional pull-and-jet cleaning option. Once again, an historical reference proves very beneficial in determining the type of cleaning to perform.
ERIC LÉGARÉ (Andeavor Martinez Refinery)
Heat exchanger monitoring is an important part of an effective Unit Health Monitoring plan when used with an accurate preheat train model. It is not only important for the crude unit’s preheat train, but also for other refinery units that count on heat exchange. Poor heat exchange can reduce the inlet temperature to the crude fractionator and/or reduce crude throughput if the unit is already running close to its hydraulic limits.
Online TIs or IR guns/local TIs can all be used to generate trendable data when inputted into your PI system, Excel model, or Simulation software. Ensure that any IR measurements are established using fixed targets in the field. This allows for consistent field measure for reliable long-term trends. Updating the models and sharing the results as part of an ongoing unit health monitoring effort will increase the visibility of this information to the refinery organization.
Having regularly pulled data will make for a more meaningful trend than trying to force a curve through the three or four data points that were pulled just weeks prior to a planned outage.
Engage operators in pulling the data as part of a weekly round so the engineer can spend his/her time analyzing the data. The engineer should personally collect the data at least once to understand the orientation of each TI relative to the exchange inlet/outlet flanges. It is also a good idea for the process engineer to understand the field work being done to support their efforts.
The engineer should have data trends well-populated and clearly indicating a downward trend in heat exchange coefficient for each exchanger they are trying to get cleaned. If possible, use the unit start-of-run (SOR) as a baseline. Let this be a reminder to perform a heat exchanger survey right after a turnaround or maintenance outage when you know your exchangers are at SOR.
Use a spring-cleaning program to identify and clean fouled exchangers prior to the hotter summer months. This program allows for exchangers to be pulled and cleaned while unit rates can be maintained. Having the performance curves available makes it easy to justify adding exchangers to this program.
Make sure the exchanger performance curves are part of your unit monitoring report. Present updates to your leadership so they are aware of the work you are doing on monitoring exchanger performance. Engage your chemical provider if you feel a chemical solution will help improve exchanger performance until the next opportunity. Are the dispersant and antifoulant dosages, correct?
Understand the cause and effect of each fouled exchanger so you can answer the question: “What if we do not clean the exchanger this time?” Will the fouled exchanger limit desalter efficiency or expose a heater limit? Will it reduce gasoil recovery and introduce a new downstream limit? Having this information and relating it to the refinery business case will improve your chances of having your exchanger added to the worklist.
CHRIS CLAESEN (NALCO Champion)
We have developed a sophisticated program called MONITOR™ that allows us to calculate the cost of fouling and help determine the optimum cleaning frequency and fouling control strategy. Heat loss is calculated for each exchanger, and cleaning planning is based on the cost of fouling.
GREG SAVAGE (NALCO Champion)
The MONITOR™ heat transfer simulation program was developed specifically to monitor fouling, as well as economic evaluation of heat exchanger networks for cleaning and treatment. Process conditions – such as temperatures, flow rates, and stream properties – are specified, and the software determines the fouling factors for all exchangers in the network and a normalized furnace inlet temperature utilizing the fouling factors. MONITOR™ performs two-phase flow and flash calculations for complex blends, as well as modeling vaporization rates in heaters. The calculated parameters are then plotted to investigate the rate of fouling and its effect on the network. The economic impact of the fouling is also examined, as are the benefits of cleaning exchangers, by evaluating the maintenance costs, energy, and throughput penalties associated with bypassing and cleaning each exchanger individually, as well as in user established groups, versus the effect of cleaning on the furnace inlet temperature. Optimum cleaning frequency is determined when the costs of fouling control is equal to the fouling costs.